Scotch-Irish vs Subsaharan African Unemployment Among Ages 20 to 24 years
COMPARE
Scotch-Irish
Subsaharan African
Unemployment Among Ages 20 to 24 years
Unemployment Among Ages 20 to 24 years Comparison
Scotch-Irish
Sub-Saharan Africans
10.0%
UNEMPLOYMENT AMONG AGES 20 TO 24 YEARS
96.2/ 100
METRIC RATING
95th/ 347
METRIC RANK
11.1%
UNEMPLOYMENT AMONG AGES 20 TO 24 YEARS
0.0/ 100
METRIC RATING
264th/ 347
METRIC RANK
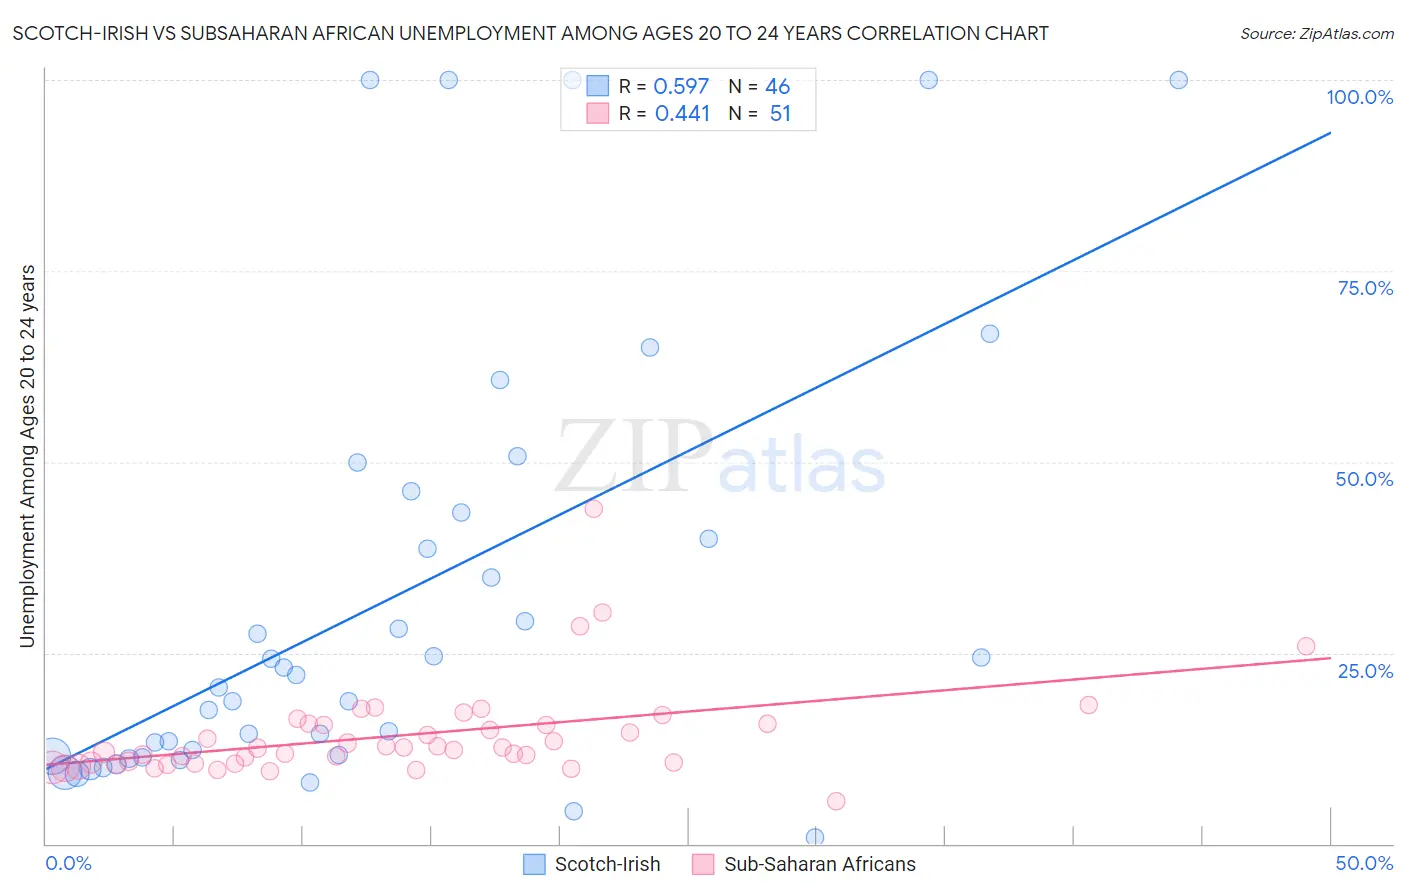
Scotch-Irish vs Subsaharan African Unemployment Among Ages 20 to 24 years Correlation Chart
The statistical analysis conducted on geographies consisting of 505,476,412 people shows a substantial positive correlation between the proportion of Scotch-Irish and unemployment rate among population between the ages 20 and 24 in the United States with a correlation coefficient (R) of 0.597 and weighted average of 10.0%. Similarly, the statistical analysis conducted on geographies consisting of 484,655,808 people shows a moderate positive correlation between the proportion of Sub-Saharan Africans and unemployment rate among population between the ages 20 and 24 in the United States with a correlation coefficient (R) of 0.441 and weighted average of 11.1%, a difference of 10.7%.
Unemployment Among Ages 20 to 24 years Correlation Summary
| Measurement | Scotch-Irish | Subsaharan African |
| Minimum | 0.90% | 5.5% |
| Maximum | 100.0% | 43.9% |
| Range | 99.1% | 38.4% |
| Mean | 32.1% | 14.2% |
| Median | 21.2% | 12.5% |
| Interquartile 25% (IQ1) | 11.5% | 10.5% |
| Interquartile 75% (IQ3) | 43.4% | 15.7% |
| Interquartile Range (IQR) | 31.9% | 5.2% |
| Standard Deviation (Sample) | 28.8% | 6.3% |
| Standard Deviation (Population) | 28.5% | 6.2% |
Similar Demographics by Unemployment Among Ages 20 to 24 years
Demographics Similar to Scotch-Irish by Unemployment Among Ages 20 to 24 years
In terms of unemployment among ages 20 to 24 years, the demographic groups most similar to Scotch-Irish are Thai (10.0%, a difference of 0.0%), Slavic (10.0%, a difference of 0.040%), Immigrants from Micronesia (10.0%, a difference of 0.10%), Immigrants from Malaysia (10.0%, a difference of 0.19%), and Bangladeshi (10.0%, a difference of 0.20%).
| Demographics | Rating | Rank | Unemployment Among Ages 20 to 24 years |
| Poles | 97.1 /100 | #88 | Exceptional 10.0% |
| Macedonians | 97.0 /100 | #89 | Exceptional 10.0% |
| Chileans | 97.0 /100 | #90 | Exceptional 10.0% |
| Bhutanese | 96.9 /100 | #91 | Exceptional 10.0% |
| Bangladeshis | 96.9 /100 | #92 | Exceptional 10.0% |
| Immigrants | Malaysia | 96.9 /100 | #93 | Exceptional 10.0% |
| Immigrants | Micronesia | 96.6 /100 | #94 | Exceptional 10.0% |
| Scotch-Irish | 96.2 /100 | #95 | Exceptional 10.0% |
| Thais | 96.2 /100 | #96 | Exceptional 10.0% |
| Slavs | 96.1 /100 | #97 | Exceptional 10.0% |
| Japanese | 95.4 /100 | #98 | Exceptional 10.0% |
| Fijians | 95.3 /100 | #99 | Exceptional 10.0% |
| Immigrants | France | 95.2 /100 | #100 | Exceptional 10.0% |
| Laotians | 95.1 /100 | #101 | Exceptional 10.0% |
| Immigrants | Argentina | 94.9 /100 | #102 | Exceptional 10.0% |
Demographics Similar to Sub-Saharan Africans by Unemployment Among Ages 20 to 24 years
In terms of unemployment among ages 20 to 24 years, the demographic groups most similar to Sub-Saharan Africans are Immigrants from Ireland (11.1%, a difference of 0.070%), Immigrants from Liberia (11.1%, a difference of 0.16%), Immigrants from Greece (11.1%, a difference of 0.44%), Marshallese (11.0%, a difference of 0.75%), and Maltese (11.2%, a difference of 0.89%).
| Demographics | Rating | Rank | Unemployment Among Ages 20 to 24 years |
| Immigrants | Western Asia | 0.3 /100 | #257 | Tragic 10.9% |
| Dutch West Indians | 0.3 /100 | #258 | Tragic 10.9% |
| Panamanians | 0.2 /100 | #259 | Tragic 10.9% |
| Immigrants | Lebanon | 0.2 /100 | #260 | Tragic 10.9% |
| Puget Sound Salish | 0.2 /100 | #261 | Tragic 10.9% |
| Immigrants | Latin America | 0.1 /100 | #262 | Tragic 11.0% |
| Marshallese | 0.1 /100 | #263 | Tragic 11.0% |
| Sub-Saharan Africans | 0.0 /100 | #264 | Tragic 11.1% |
| Immigrants | Ireland | 0.0 /100 | #265 | Tragic 11.1% |
| Immigrants | Liberia | 0.0 /100 | #266 | Tragic 11.1% |
| Immigrants | Greece | 0.0 /100 | #267 | Tragic 11.1% |
| Maltese | 0.0 /100 | #268 | Tragic 11.2% |
| Ute | 0.0 /100 | #269 | Tragic 11.2% |
| Delaware | 0.0 /100 | #270 | Tragic 11.3% |
| Immigrants | Uzbekistan | 0.0 /100 | #271 | Tragic 11.4% |