Immigrants from Scotland vs Subsaharan African Disability Age 35 to 64
COMPARE
Immigrants from Scotland
Subsaharan African
Disability Age 35 to 64
Disability Age 35 to 64 Comparison
Immigrants from Scotland
Sub-Saharan Africans
10.7%
DISABILITY AGE 35 TO 64
91.3/ 100
METRIC RATING
140th/ 347
METRIC RANK
12.6%
DISABILITY AGE 35 TO 64
0.2/ 100
METRIC RATING
267th/ 347
METRIC RANK
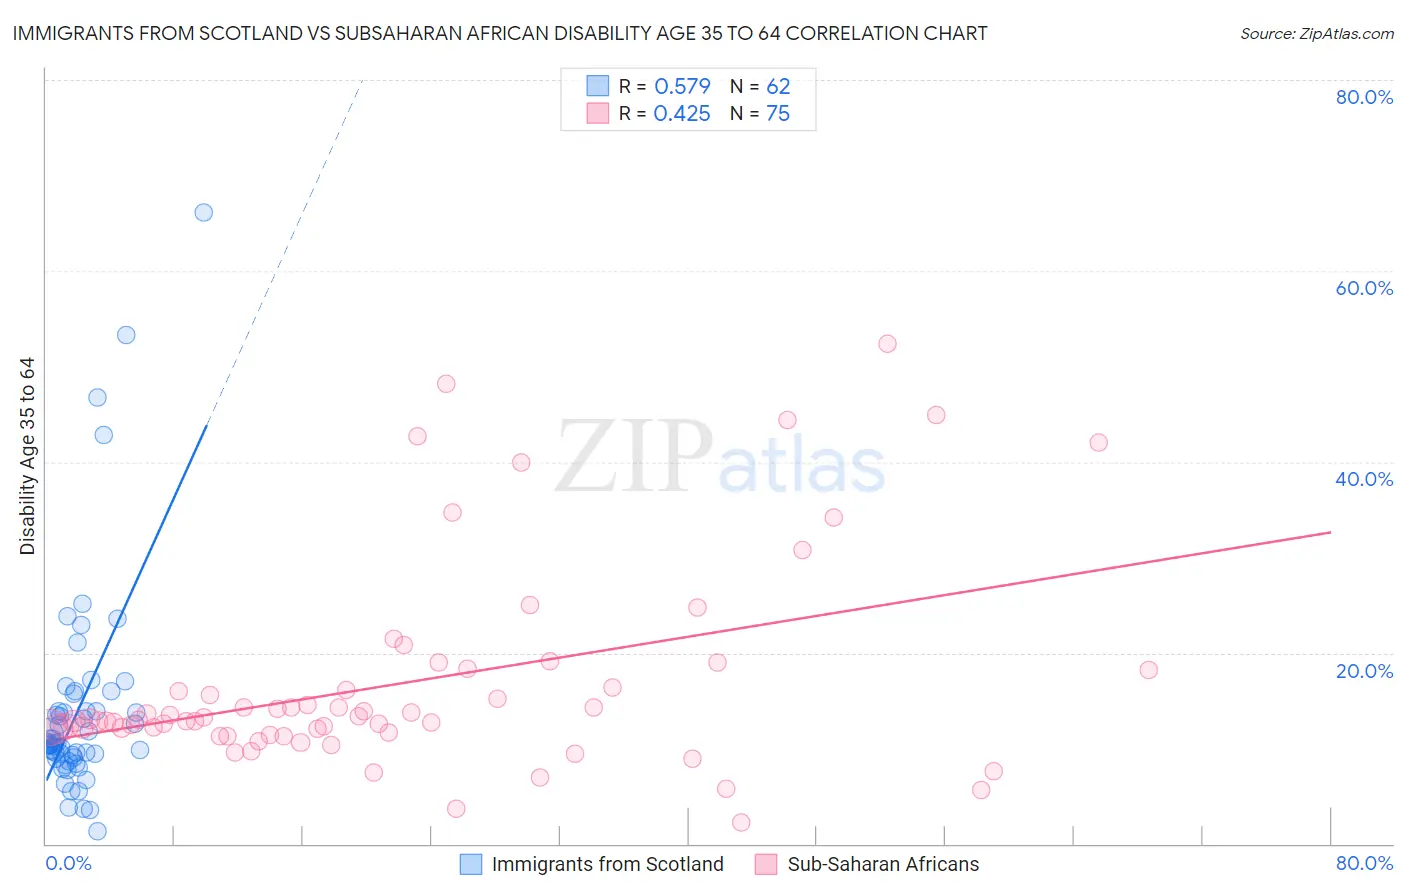
Immigrants from Scotland vs Subsaharan African Disability Age 35 to 64 Correlation Chart
The statistical analysis conducted on geographies consisting of 196,374,606 people shows a substantial positive correlation between the proportion of Immigrants from Scotland and percentage of population with a disability between the ages 34 and 64 in the United States with a correlation coefficient (R) of 0.579 and weighted average of 10.7%. Similarly, the statistical analysis conducted on geographies consisting of 507,479,662 people shows a moderate positive correlation between the proportion of Sub-Saharan Africans and percentage of population with a disability between the ages 34 and 64 in the United States with a correlation coefficient (R) of 0.425 and weighted average of 12.6%, a difference of 17.7%.
Disability Age 35 to 64 Correlation Summary
| Measurement | Immigrants from Scotland | Subsaharan African |
| Minimum | 1.3% | 2.2% |
| Maximum | 66.1% | 52.4% |
| Range | 64.9% | 50.2% |
| Mean | 14.1% | 16.8% |
| Median | 10.5% | 12.9% |
| Interquartile 25% (IQ1) | 9.1% | 11.6% |
| Interquartile 75% (IQ3) | 13.9% | 18.2% |
| Interquartile Range (IQR) | 4.9% | 6.5% |
| Standard Deviation (Sample) | 11.4% | 10.7% |
| Standard Deviation (Population) | 11.3% | 10.7% |
Similar Demographics by Disability Age 35 to 64
Demographics Similar to Immigrants from Scotland by Disability Age 35 to 64
In terms of disability age 35 to 64, the demographic groups most similar to Immigrants from Scotland are Costa Rican (10.7%, a difference of 0.050%), Immigrants from Southern Europe (10.7%, a difference of 0.060%), Immigrants from Costa Rica (10.7%, a difference of 0.12%), Australian (10.8%, a difference of 0.13%), and Immigrants from Saudi Arabia (10.8%, a difference of 0.17%).
| Demographics | Rating | Rank | Disability Age 35 to 64 |
| Immigrants | Immigrants | 92.5 /100 | #133 | Exceptional 10.7% |
| Immigrants | Ecuador | 92.5 /100 | #134 | Exceptional 10.7% |
| Greeks | 92.3 /100 | #135 | Exceptional 10.7% |
| Salvadorans | 91.9 /100 | #136 | Exceptional 10.7% |
| Immigrants | Costa Rica | 91.7 /100 | #137 | Exceptional 10.7% |
| Immigrants | Southern Europe | 91.5 /100 | #138 | Exceptional 10.7% |
| Costa Ricans | 91.4 /100 | #139 | Exceptional 10.7% |
| Immigrants | Scotland | 91.3 /100 | #140 | Exceptional 10.7% |
| Australians | 90.7 /100 | #141 | Exceptional 10.8% |
| Immigrants | Saudi Arabia | 90.6 /100 | #142 | Exceptional 10.8% |
| Sierra Leoneans | 89.7 /100 | #143 | Excellent 10.8% |
| Lithuanians | 88.7 /100 | #144 | Excellent 10.8% |
| Immigrants | Bangladesh | 85.6 /100 | #145 | Excellent 10.9% |
| South American Indians | 83.5 /100 | #146 | Excellent 10.9% |
| Immigrants | Eritrea | 83.4 /100 | #147 | Excellent 10.9% |
Demographics Similar to Sub-Saharan Africans by Disability Age 35 to 64
In terms of disability age 35 to 64, the demographic groups most similar to Sub-Saharan Africans are White/Caucasian (12.6%, a difference of 0.16%), Immigrants from Dominica (12.7%, a difference of 0.18%), Spanish (12.7%, a difference of 0.28%), French (12.7%, a difference of 0.33%), and Marshallese (12.5%, a difference of 0.86%).
| Demographics | Rating | Rank | Disability Age 35 to 64 |
| German Russians | 0.5 /100 | #260 | Tragic 12.5% |
| Malaysians | 0.5 /100 | #261 | Tragic 12.5% |
| Senegalese | 0.5 /100 | #262 | Tragic 12.5% |
| Immigrants | Zaire | 0.4 /100 | #263 | Tragic 12.5% |
| Immigrants | Portugal | 0.4 /100 | #264 | Tragic 12.5% |
| Marshallese | 0.4 /100 | #265 | Tragic 12.5% |
| Whites/Caucasians | 0.3 /100 | #266 | Tragic 12.6% |
| Sub-Saharan Africans | 0.2 /100 | #267 | Tragic 12.6% |
| Immigrants | Dominica | 0.2 /100 | #268 | Tragic 12.7% |
| Spanish | 0.2 /100 | #269 | Tragic 12.7% |
| French | 0.2 /100 | #270 | Tragic 12.7% |
| Nepalese | 0.1 /100 | #271 | Tragic 12.8% |
| U.S. Virgin Islanders | 0.1 /100 | #272 | Tragic 12.8% |
| Pennsylvania Germans | 0.1 /100 | #273 | Tragic 12.8% |
| Celtics | 0.1 /100 | #274 | Tragic 12.9% |