Immigrants from Western Africa vs Subsaharan African Disability Age 35 to 64
COMPARE
Immigrants from Western Africa
Subsaharan African
Disability Age 35 to 64
Disability Age 35 to 64 Comparison
Immigrants from Western Africa
Sub-Saharan Africans
12.0%
DISABILITY AGE 35 TO 64
3.3/ 100
METRIC RATING
239th/ 347
METRIC RANK
12.6%
DISABILITY AGE 35 TO 64
0.2/ 100
METRIC RATING
267th/ 347
METRIC RANK
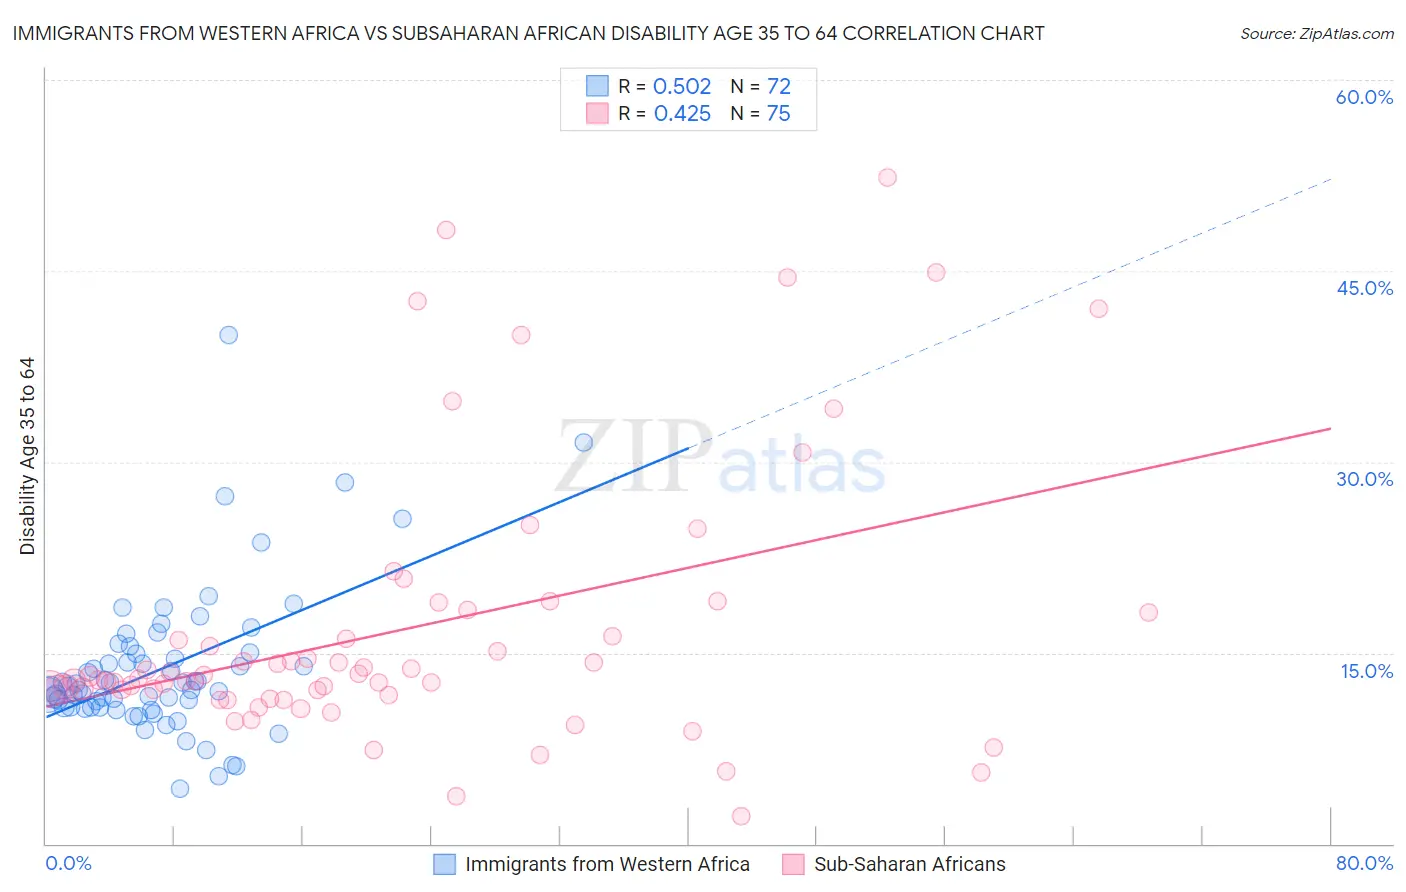
Immigrants from Western Africa vs Subsaharan African Disability Age 35 to 64 Correlation Chart
The statistical analysis conducted on geographies consisting of 357,521,176 people shows a substantial positive correlation between the proportion of Immigrants from Western Africa and percentage of population with a disability between the ages 34 and 64 in the United States with a correlation coefficient (R) of 0.502 and weighted average of 12.0%. Similarly, the statistical analysis conducted on geographies consisting of 507,479,662 people shows a moderate positive correlation between the proportion of Sub-Saharan Africans and percentage of population with a disability between the ages 34 and 64 in the United States with a correlation coefficient (R) of 0.425 and weighted average of 12.6%, a difference of 5.0%.
Disability Age 35 to 64 Correlation Summary
| Measurement | Immigrants from Western Africa | Subsaharan African |
| Minimum | 4.3% | 2.2% |
| Maximum | 40.0% | 52.4% |
| Range | 35.7% | 50.2% |
| Mean | 13.8% | 16.8% |
| Median | 12.3% | 12.9% |
| Interquartile 25% (IQ1) | 10.7% | 11.6% |
| Interquartile 75% (IQ3) | 15.0% | 18.2% |
| Interquartile Range (IQR) | 4.3% | 6.5% |
| Standard Deviation (Sample) | 5.9% | 10.7% |
| Standard Deviation (Population) | 5.8% | 10.7% |
Similar Demographics by Disability Age 35 to 64
Demographics Similar to Immigrants from Western Africa by Disability Age 35 to 64
In terms of disability age 35 to 64, the demographic groups most similar to Immigrants from Western Africa are Immigrants from Thailand (12.0%, a difference of 0.010%), Mexican American Indian (12.0%, a difference of 0.030%), West Indian (12.0%, a difference of 0.26%), Samoan (12.1%, a difference of 0.30%), and Immigrants from Cambodia (12.0%, a difference of 0.36%).
| Demographics | Rating | Rank | Disability Age 35 to 64 |
| Sudanese | 5.3 /100 | #232 | Tragic 11.9% |
| Bermudans | 5.0 /100 | #233 | Tragic 11.9% |
| Portuguese | 4.9 /100 | #234 | Tragic 11.9% |
| Belizeans | 4.5 /100 | #235 | Tragic 12.0% |
| Immigrants | Middle Africa | 4.5 /100 | #236 | Tragic 12.0% |
| Immigrants | Cambodia | 3.9 /100 | #237 | Tragic 12.0% |
| West Indians | 3.7 /100 | #238 | Tragic 12.0% |
| Immigrants | Western Africa | 3.3 /100 | #239 | Tragic 12.0% |
| Immigrants | Thailand | 3.3 /100 | #240 | Tragic 12.0% |
| Mexican American Indians | 3.2 /100 | #241 | Tragic 12.0% |
| Samoans | 2.8 /100 | #242 | Tragic 12.1% |
| Slovaks | 2.7 /100 | #243 | Tragic 12.1% |
| Finns | 2.3 /100 | #244 | Tragic 12.1% |
| Immigrants | Mexico | 2.2 /100 | #245 | Tragic 12.1% |
| Guamanians/Chamorros | 1.4 /100 | #246 | Tragic 12.2% |
Demographics Similar to Sub-Saharan Africans by Disability Age 35 to 64
In terms of disability age 35 to 64, the demographic groups most similar to Sub-Saharan Africans are White/Caucasian (12.6%, a difference of 0.16%), Immigrants from Dominica (12.7%, a difference of 0.18%), Spanish (12.7%, a difference of 0.28%), French (12.7%, a difference of 0.33%), and Marshallese (12.5%, a difference of 0.86%).
| Demographics | Rating | Rank | Disability Age 35 to 64 |
| German Russians | 0.5 /100 | #260 | Tragic 12.5% |
| Malaysians | 0.5 /100 | #261 | Tragic 12.5% |
| Senegalese | 0.5 /100 | #262 | Tragic 12.5% |
| Immigrants | Zaire | 0.4 /100 | #263 | Tragic 12.5% |
| Immigrants | Portugal | 0.4 /100 | #264 | Tragic 12.5% |
| Marshallese | 0.4 /100 | #265 | Tragic 12.5% |
| Whites/Caucasians | 0.3 /100 | #266 | Tragic 12.6% |
| Sub-Saharan Africans | 0.2 /100 | #267 | Tragic 12.6% |
| Immigrants | Dominica | 0.2 /100 | #268 | Tragic 12.7% |
| Spanish | 0.2 /100 | #269 | Tragic 12.7% |
| French | 0.2 /100 | #270 | Tragic 12.7% |
| Nepalese | 0.1 /100 | #271 | Tragic 12.8% |
| U.S. Virgin Islanders | 0.1 /100 | #272 | Tragic 12.8% |
| Pennsylvania Germans | 0.1 /100 | #273 | Tragic 12.8% |
| Celtics | 0.1 /100 | #274 | Tragic 12.9% |