Scotch-Irish vs Subsaharan African High School Diploma
COMPARE
Scotch-Irish
Subsaharan African
High School Diploma
High School Diploma Comparison
Scotch-Irish
Sub-Saharan Africans
90.8%
HIGH SCHOOL DIPLOMA
99.2/ 100
METRIC RATING
82nd/ 347
METRIC RANK
87.9%
HIGH SCHOOL DIPLOMA
2.8/ 100
METRIC RATING
236th/ 347
METRIC RANK
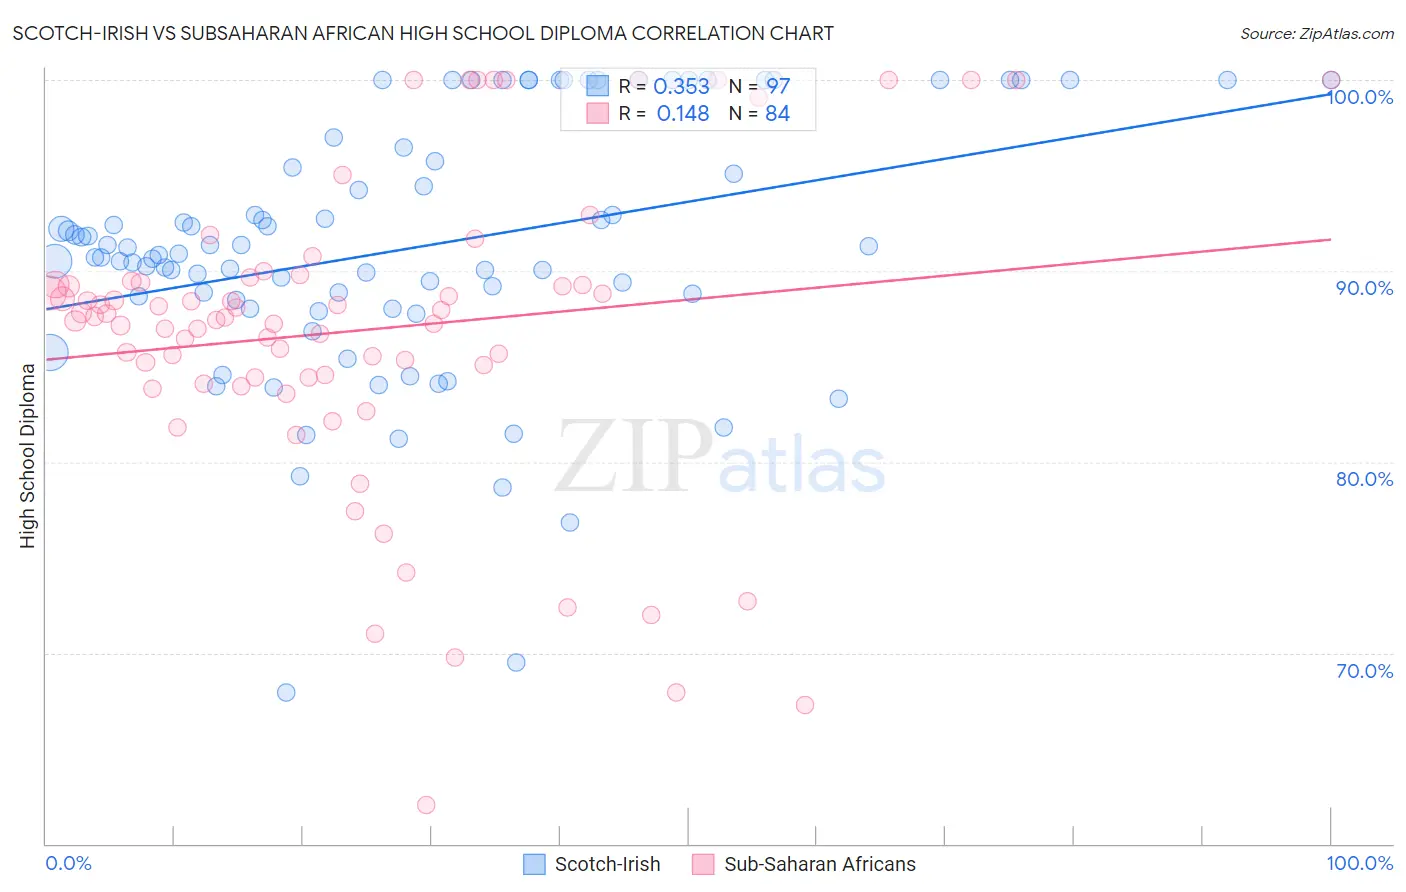
Scotch-Irish vs Subsaharan African High School Diploma Correlation Chart
The statistical analysis conducted on geographies consisting of 548,780,422 people shows a mild positive correlation between the proportion of Scotch-Irish and percentage of population with at least high school diploma education in the United States with a correlation coefficient (R) of 0.353 and weighted average of 90.8%. Similarly, the statistical analysis conducted on geographies consisting of 508,219,008 people shows a poor positive correlation between the proportion of Sub-Saharan Africans and percentage of population with at least high school diploma education in the United States with a correlation coefficient (R) of 0.148 and weighted average of 87.9%, a difference of 3.2%.
High School Diploma Correlation Summary
| Measurement | Scotch-Irish | Subsaharan African |
| Minimum | 67.9% | 62.1% |
| Maximum | 100.0% | 100.0% |
| Range | 32.1% | 37.9% |
| Mean | 91.2% | 86.9% |
| Median | 90.9% | 87.6% |
| Interquartile 25% (IQ1) | 88.2% | 84.4% |
| Interquartile 75% (IQ3) | 96.1% | 89.4% |
| Interquartile Range (IQR) | 7.9% | 5.0% |
| Standard Deviation (Sample) | 6.7% | 8.1% |
| Standard Deviation (Population) | 6.7% | 8.0% |
Similar Demographics by High School Diploma
Demographics Similar to Scotch-Irish by High School Diploma
In terms of high school diploma, the demographic groups most similar to Scotch-Irish are Immigrants from Moldova (90.7%, a difference of 0.020%), Immigrants from England (90.8%, a difference of 0.040%), Immigrants from Switzerland (90.8%, a difference of 0.040%), Immigrants from Denmark (90.8%, a difference of 0.050%), and Immigrants from Saudi Arabia (90.7%, a difference of 0.050%).
| Demographics | Rating | Rank | High School Diploma |
| Cambodians | 99.4 /100 | #75 | Exceptional 90.8% |
| Hungarians | 99.3 /100 | #76 | Exceptional 90.8% |
| Native Hawaiians | 99.3 /100 | #77 | Exceptional 90.8% |
| Burmese | 99.3 /100 | #78 | Exceptional 90.8% |
| Immigrants | Denmark | 99.3 /100 | #79 | Exceptional 90.8% |
| Immigrants | England | 99.3 /100 | #80 | Exceptional 90.8% |
| Immigrants | Switzerland | 99.3 /100 | #81 | Exceptional 90.8% |
| Scotch-Irish | 99.2 /100 | #82 | Exceptional 90.8% |
| Immigrants | Moldova | 99.2 /100 | #83 | Exceptional 90.7% |
| Immigrants | Saudi Arabia | 99.1 /100 | #84 | Exceptional 90.7% |
| Romanians | 98.9 /100 | #85 | Exceptional 90.7% |
| Immigrants | Bulgaria | 98.9 /100 | #86 | Exceptional 90.6% |
| Immigrants | Turkey | 98.9 /100 | #87 | Exceptional 90.6% |
| Immigrants | France | 98.8 /100 | #88 | Exceptional 90.6% |
| Canadians | 98.7 /100 | #89 | Exceptional 90.6% |
Demographics Similar to Sub-Saharan Africans by High School Diploma
In terms of high school diploma, the demographic groups most similar to Sub-Saharan Africans are Taiwanese (87.9%, a difference of 0.010%), Sioux (87.9%, a difference of 0.010%), South American (87.9%, a difference of 0.010%), Immigrants from Bahamas (88.0%, a difference of 0.020%), and Immigrants from Panama (88.0%, a difference of 0.040%).
| Demographics | Rating | Rank | High School Diploma |
| Nigerians | 5.2 /100 | #229 | Tragic 88.2% |
| Blackfeet | 4.2 /100 | #230 | Tragic 88.1% |
| Colombians | 3.8 /100 | #231 | Tragic 88.1% |
| Immigrants | Middle Africa | 3.4 /100 | #232 | Tragic 88.0% |
| Immigrants | Panama | 3.1 /100 | #233 | Tragic 88.0% |
| Immigrants | Thailand | 3.1 /100 | #234 | Tragic 88.0% |
| Immigrants | Bahamas | 2.9 /100 | #235 | Tragic 88.0% |
| Sub-Saharan Africans | 2.8 /100 | #236 | Tragic 87.9% |
| Taiwanese | 2.8 /100 | #237 | Tragic 87.9% |
| Sioux | 2.7 /100 | #238 | Tragic 87.9% |
| South Americans | 2.7 /100 | #239 | Tragic 87.9% |
| Comanche | 2.2 /100 | #240 | Tragic 87.9% |
| Immigrants | Uzbekistan | 2.1 /100 | #241 | Tragic 87.8% |
| Cheyenne | 2.1 /100 | #242 | Tragic 87.8% |
| Immigrants | Philippines | 1.9 /100 | #243 | Tragic 87.8% |