Immigrants from Burma/Myanmar vs Subsaharan African Disability Age 35 to 64
COMPARE
Immigrants from Burma/Myanmar
Subsaharan African
Disability Age 35 to 64
Disability Age 35 to 64 Comparison
Immigrants from Burma/Myanmar
Sub-Saharan Africans
12.3%
DISABILITY AGE 35 TO 64
1.2/ 100
METRIC RATING
250th/ 347
METRIC RANK
12.6%
DISABILITY AGE 35 TO 64
0.2/ 100
METRIC RATING
267th/ 347
METRIC RANK
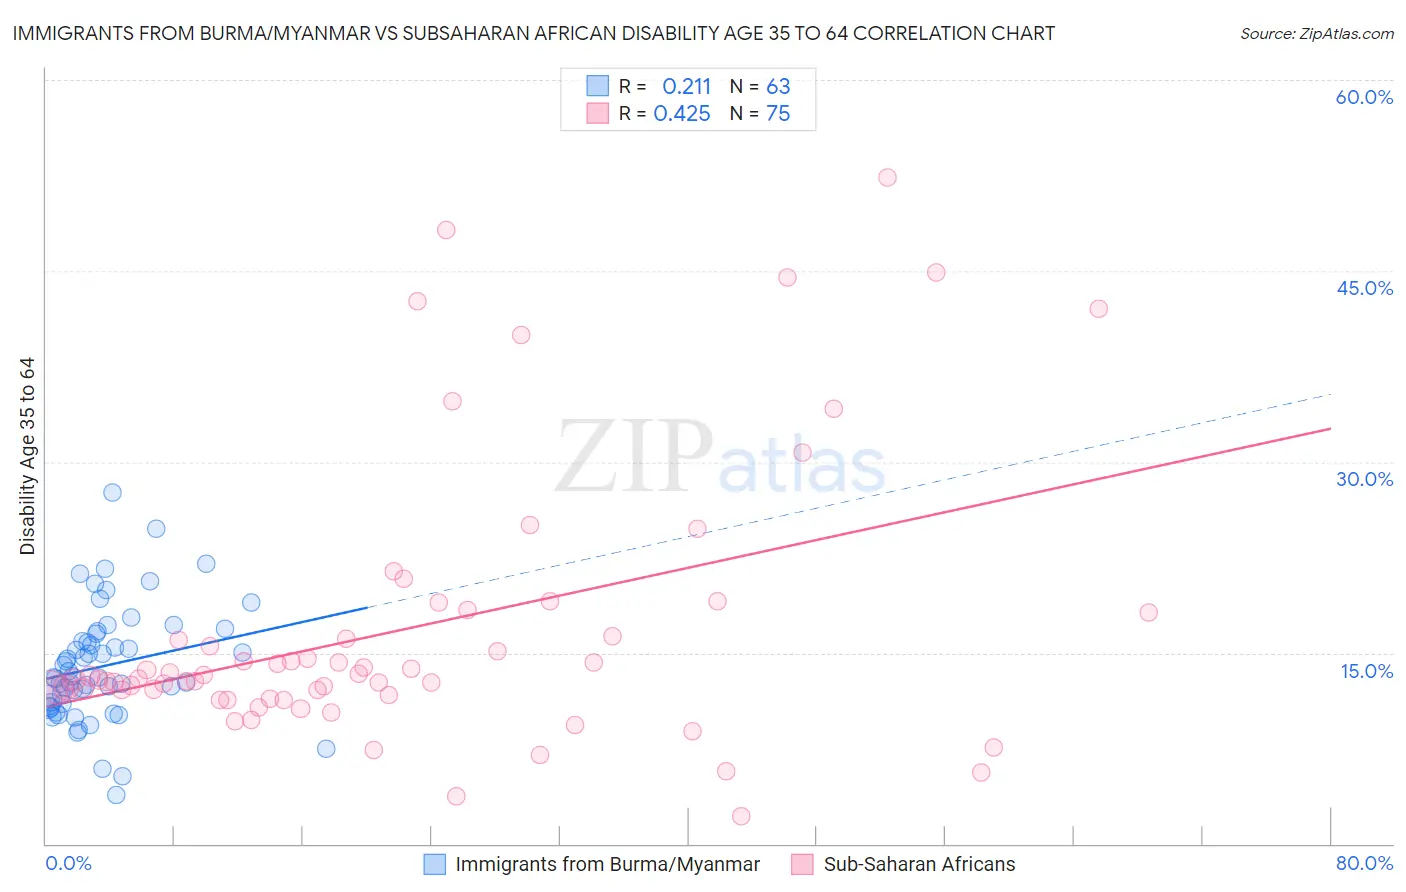
Immigrants from Burma/Myanmar vs Subsaharan African Disability Age 35 to 64 Correlation Chart
The statistical analysis conducted on geographies consisting of 172,272,577 people shows a weak positive correlation between the proportion of Immigrants from Burma/Myanmar and percentage of population with a disability between the ages 34 and 64 in the United States with a correlation coefficient (R) of 0.211 and weighted average of 12.3%. Similarly, the statistical analysis conducted on geographies consisting of 507,479,662 people shows a moderate positive correlation between the proportion of Sub-Saharan Africans and percentage of population with a disability between the ages 34 and 64 in the United States with a correlation coefficient (R) of 0.425 and weighted average of 12.6%, a difference of 3.0%.
Disability Age 35 to 64 Correlation Summary
| Measurement | Immigrants from Burma/Myanmar | Subsaharan African |
| Minimum | 3.9% | 2.2% |
| Maximum | 27.6% | 52.4% |
| Range | 23.7% | 50.2% |
| Mean | 14.0% | 16.8% |
| Median | 13.1% | 12.9% |
| Interquartile 25% (IQ1) | 11.0% | 11.6% |
| Interquartile 75% (IQ3) | 16.5% | 18.2% |
| Interquartile Range (IQR) | 5.5% | 6.5% |
| Standard Deviation (Sample) | 4.5% | 10.7% |
| Standard Deviation (Population) | 4.5% | 10.7% |
Demographics Similar to Immigrants from Burma/Myanmar and Sub-Saharan Africans by Disability Age 35 to 64
In terms of disability age 35 to 64, the demographic groups most similar to Immigrants from Burma/Myanmar are German (12.3%, a difference of 0.080%), Hispanic or Latino (12.3%, a difference of 0.13%), Spaniard (12.3%, a difference of 0.16%), Irish (12.3%, a difference of 0.33%), and Dutch (12.3%, a difference of 0.36%). Similarly, the demographic groups most similar to Sub-Saharan Africans are White/Caucasian (12.6%, a difference of 0.16%), Immigrants from Dominica (12.7%, a difference of 0.18%), Marshallese (12.5%, a difference of 0.86%), Immigrants from Portugal (12.5%, a difference of 0.97%), and Immigrants from Zaire (12.5%, a difference of 0.99%).
| Demographics | Rating | Rank | Disability Age 35 to 64 |
| Spaniards | 1.3 /100 | #248 | Tragic 12.3% |
| Hispanics or Latinos | 1.3 /100 | #249 | Tragic 12.3% |
| Immigrants | Burma/Myanmar | 1.2 /100 | #250 | Tragic 12.3% |
| Germans | 1.1 /100 | #251 | Tragic 12.3% |
| Irish | 1.0 /100 | #252 | Tragic 12.3% |
| Dutch | 1.0 /100 | #253 | Tragic 12.3% |
| Hawaiians | 0.9 /100 | #254 | Tragic 12.3% |
| Japanese | 0.8 /100 | #255 | Tragic 12.3% |
| Scottish | 0.8 /100 | #256 | Tragic 12.4% |
| Mexicans | 0.7 /100 | #257 | Tragic 12.4% |
| Welsh | 0.6 /100 | #258 | Tragic 12.4% |
| English | 0.6 /100 | #259 | Tragic 12.4% |
| German Russians | 0.5 /100 | #260 | Tragic 12.5% |
| Malaysians | 0.5 /100 | #261 | Tragic 12.5% |
| Senegalese | 0.5 /100 | #262 | Tragic 12.5% |
| Immigrants | Zaire | 0.4 /100 | #263 | Tragic 12.5% |
| Immigrants | Portugal | 0.4 /100 | #264 | Tragic 12.5% |
| Marshallese | 0.4 /100 | #265 | Tragic 12.5% |
| Whites/Caucasians | 0.3 /100 | #266 | Tragic 12.6% |
| Sub-Saharan Africans | 0.2 /100 | #267 | Tragic 12.6% |
| Immigrants | Dominica | 0.2 /100 | #268 | Tragic 12.7% |