Scotch-Irish vs Subsaharan African Unemployment Among Ages 55 to 59 years
COMPARE
Scotch-Irish
Subsaharan African
Unemployment Among Ages 55 to 59 years
Unemployment Among Ages 55 to 59 years Comparison
Scotch-Irish
Sub-Saharan Africans
4.6%
UNEMPLOYMENT AMONG AGES 55 TO 59 YEARS
98.3/ 100
METRIC RATING
77th/ 347
METRIC RANK
5.0%
UNEMPLOYMENT AMONG AGES 55 TO 59 YEARS
4.4/ 100
METRIC RATING
224th/ 347
METRIC RANK
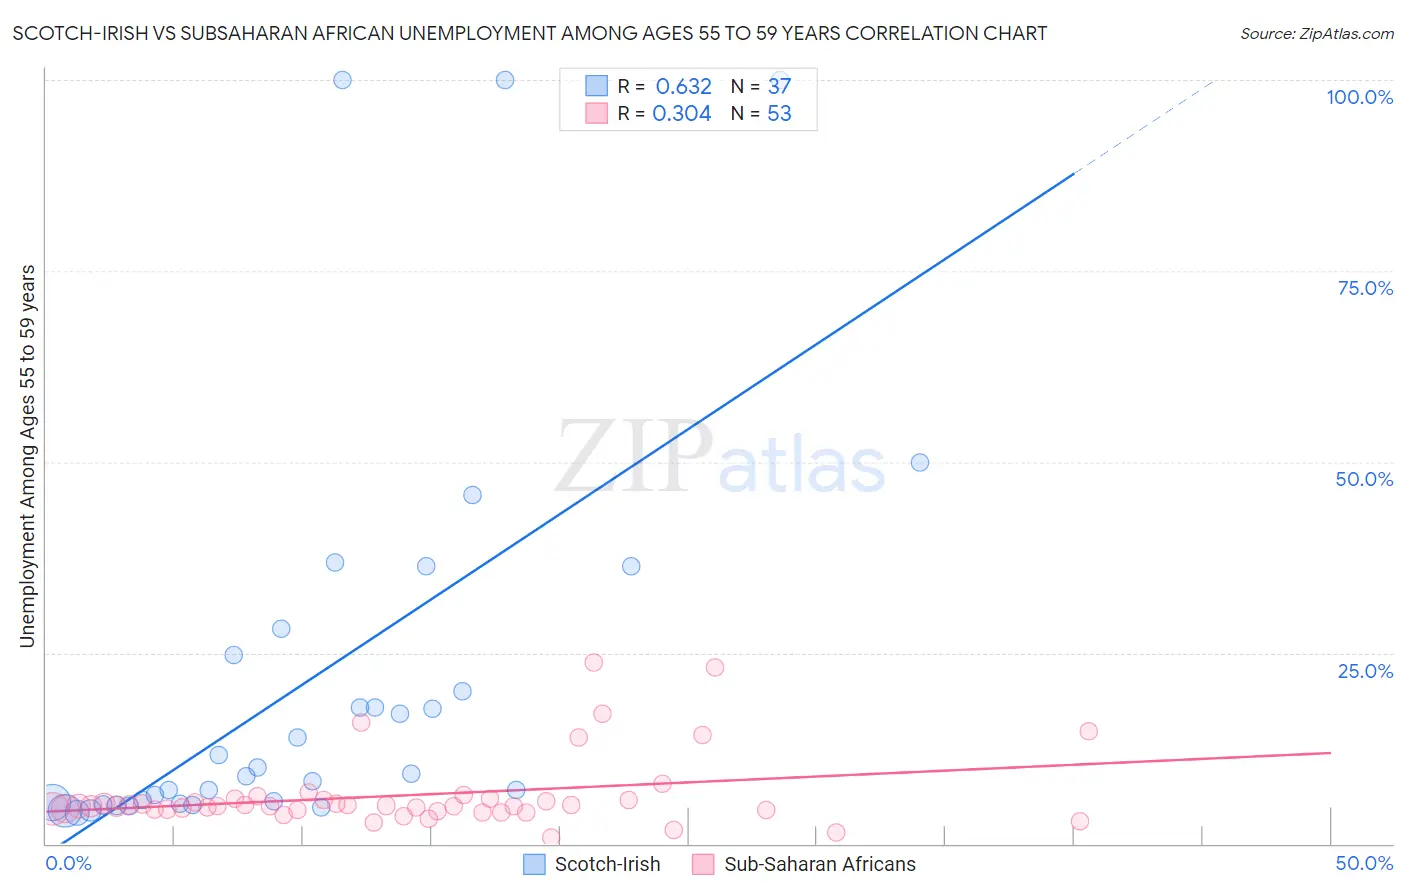
Scotch-Irish vs Subsaharan African Unemployment Among Ages 55 to 59 years Correlation Chart
The statistical analysis conducted on geographies consisting of 470,743,617 people shows a significant positive correlation between the proportion of Scotch-Irish and unemployment rate among population between the ages 55 and 59 in the United States with a correlation coefficient (R) of 0.632 and weighted average of 4.6%. Similarly, the statistical analysis conducted on geographies consisting of 455,758,057 people shows a mild positive correlation between the proportion of Sub-Saharan Africans and unemployment rate among population between the ages 55 and 59 in the United States with a correlation coefficient (R) of 0.304 and weighted average of 5.0%, a difference of 7.6%.
Unemployment Among Ages 55 to 59 years Correlation Summary
| Measurement | Scotch-Irish | Subsaharan African |
| Minimum | 4.0% | 0.90% |
| Maximum | 100.0% | 23.7% |
| Range | 96.0% | 22.8% |
| Mean | 21.6% | 6.4% |
| Median | 9.2% | 4.9% |
| Interquartile 25% (IQ1) | 5.3% | 4.4% |
| Interquartile 75% (IQ3) | 26.5% | 5.8% |
| Interquartile Range (IQR) | 21.2% | 1.4% |
| Standard Deviation (Sample) | 26.7% | 4.8% |
| Standard Deviation (Population) | 26.3% | 4.7% |
Similar Demographics by Unemployment Among Ages 55 to 59 years
Demographics Similar to Scotch-Irish by Unemployment Among Ages 55 to 59 years
In terms of unemployment among ages 55 to 59 years, the demographic groups most similar to Scotch-Irish are Immigrants from Bosnia and Herzegovina (4.6%, a difference of 0.010%), Finnish (4.6%, a difference of 0.050%), Immigrants from Iraq (4.6%, a difference of 0.080%), Croatian (4.6%, a difference of 0.10%), and Sri Lankan (4.6%, a difference of 0.14%).
| Demographics | Rating | Rank | Unemployment Among Ages 55 to 59 years |
| Filipinos | 98.8 /100 | #70 | Exceptional 4.6% |
| Immigrants | Jordan | 98.7 /100 | #71 | Exceptional 4.6% |
| Immigrants | Taiwan | 98.7 /100 | #72 | Exceptional 4.6% |
| Bhutanese | 98.6 /100 | #73 | Exceptional 4.6% |
| Croatians | 98.5 /100 | #74 | Exceptional 4.6% |
| Immigrants | Iraq | 98.5 /100 | #75 | Exceptional 4.6% |
| Immigrants | Bosnia and Herzegovina | 98.3 /100 | #76 | Exceptional 4.6% |
| Scotch-Irish | 98.3 /100 | #77 | Exceptional 4.6% |
| Finns | 98.2 /100 | #78 | Exceptional 4.6% |
| Sri Lankans | 98.1 /100 | #79 | Exceptional 4.6% |
| Cambodians | 98.0 /100 | #80 | Exceptional 4.6% |
| Taiwanese | 97.9 /100 | #81 | Exceptional 4.6% |
| Latvians | 97.8 /100 | #82 | Exceptional 4.6% |
| Lebanese | 97.5 /100 | #83 | Exceptional 4.6% |
| Malaysians | 96.9 /100 | #84 | Exceptional 4.7% |
Demographics Similar to Sub-Saharan Africans by Unemployment Among Ages 55 to 59 years
In terms of unemployment among ages 55 to 59 years, the demographic groups most similar to Sub-Saharan Africans are Costa Rican (5.0%, a difference of 0.010%), Immigrants from China (5.0%, a difference of 0.060%), Immigrants from Ireland (5.0%, a difference of 0.070%), Spanish (5.0%, a difference of 0.14%), and Immigrants from Iran (5.0%, a difference of 0.19%).
| Demographics | Rating | Rank | Unemployment Among Ages 55 to 59 years |
| Immigrants | Brazil | 8.1 /100 | #217 | Tragic 4.9% |
| Immigrants | Austria | 8.0 /100 | #218 | Tragic 4.9% |
| Immigrants | Nigeria | 8.0 /100 | #219 | Tragic 4.9% |
| Indians (Asian) | 7.6 /100 | #220 | Tragic 4.9% |
| Nigerians | 7.5 /100 | #221 | Tragic 4.9% |
| Spanish | 5.1 /100 | #222 | Tragic 5.0% |
| Immigrants | Ireland | 4.8 /100 | #223 | Tragic 5.0% |
| Sub-Saharan Africans | 4.4 /100 | #224 | Tragic 5.0% |
| Costa Ricans | 4.4 /100 | #225 | Tragic 5.0% |
| Immigrants | China | 4.2 /100 | #226 | Tragic 5.0% |
| Immigrants | Iran | 3.7 /100 | #227 | Tragic 5.0% |
| Immigrants | Liberia | 3.2 /100 | #228 | Tragic 5.0% |
| Immigrants | Western Asia | 3.0 /100 | #229 | Tragic 5.0% |
| Immigrants | Syria | 2.7 /100 | #230 | Tragic 5.0% |
| Cherokee | 2.6 /100 | #231 | Tragic 5.0% |