Scotch-Irish vs Subsaharan African Unemployment Among Ages 25 to 29 years
COMPARE
Scotch-Irish
Subsaharan African
Unemployment Among Ages 25 to 29 years
Unemployment Among Ages 25 to 29 years Comparison
Scotch-Irish
Sub-Saharan Africans
6.8%
UNEMPLOYMENT AMONG AGES 25 TO 29 YEARS
20.0/ 100
METRIC RATING
204th/ 347
METRIC RANK
7.2%
UNEMPLOYMENT AMONG AGES 25 TO 29 YEARS
0.6/ 100
METRIC RATING
248th/ 347
METRIC RANK
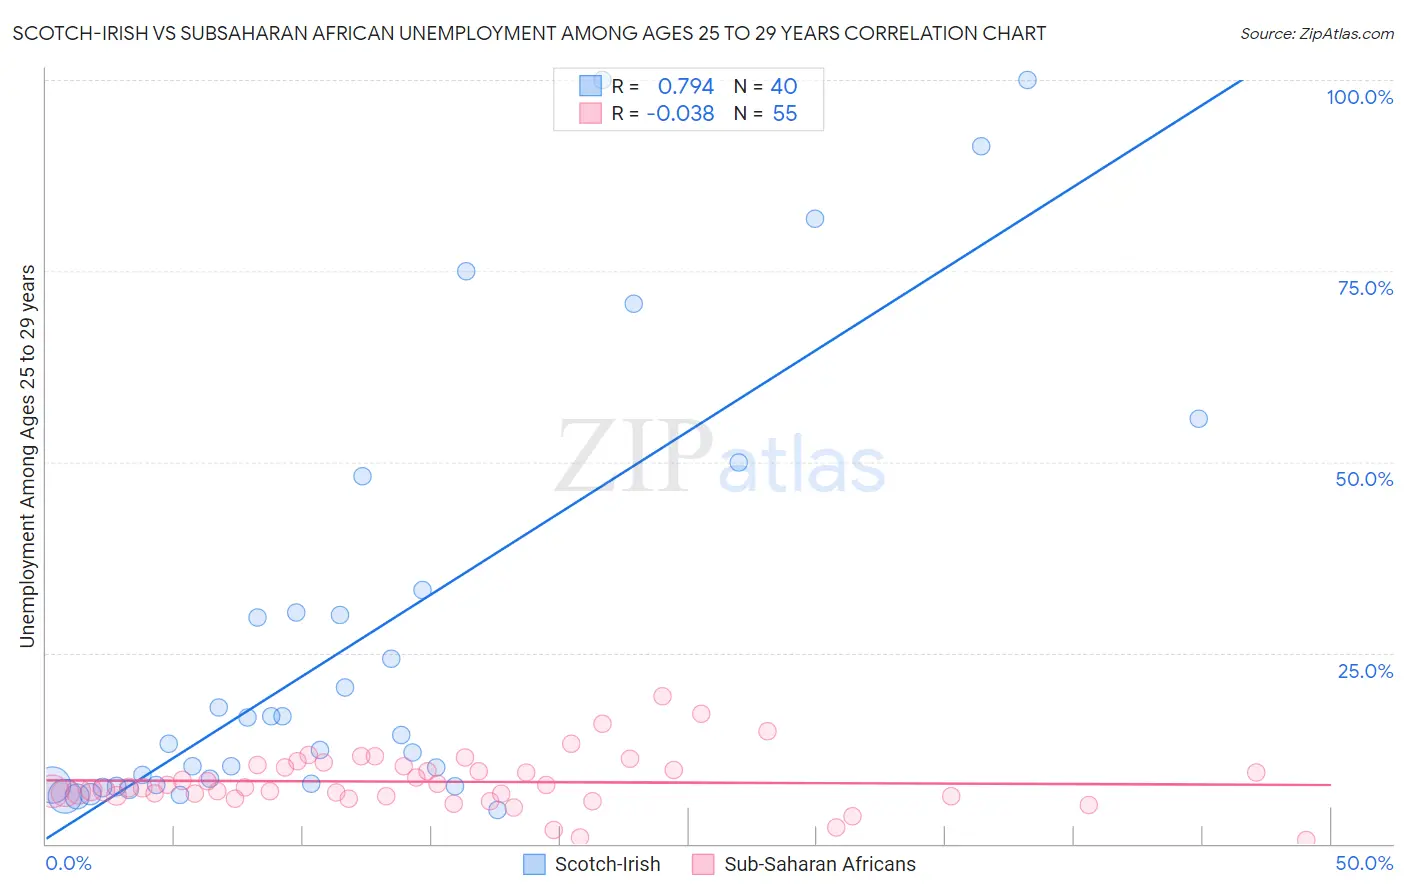
Scotch-Irish vs Subsaharan African Unemployment Among Ages 25 to 29 years Correlation Chart
The statistical analysis conducted on geographies consisting of 489,887,362 people shows a strong positive correlation between the proportion of Scotch-Irish and unemployment rate among population between the ages 25 and 29 in the United States with a correlation coefficient (R) of 0.794 and weighted average of 6.8%. Similarly, the statistical analysis conducted on geographies consisting of 472,657,928 people shows no correlation between the proportion of Sub-Saharan Africans and unemployment rate among population between the ages 25 and 29 in the United States with a correlation coefficient (R) of -0.038 and weighted average of 7.2%, a difference of 5.6%.
Unemployment Among Ages 25 to 29 years Correlation Summary
| Measurement | Scotch-Irish | Subsaharan African |
| Minimum | 4.5% | 0.50% |
| Maximum | 100.0% | 19.3% |
| Range | 95.5% | 18.8% |
| Mean | 27.2% | 8.1% |
| Median | 13.7% | 7.4% |
| Interquartile 25% (IQ1) | 7.7% | 6.3% |
| Interquartile 75% (IQ3) | 31.8% | 10.1% |
| Interquartile Range (IQR) | 24.1% | 3.8% |
| Standard Deviation (Sample) | 28.4% | 3.6% |
| Standard Deviation (Population) | 28.1% | 3.6% |
Similar Demographics by Unemployment Among Ages 25 to 29 years
Demographics Similar to Scotch-Irish by Unemployment Among Ages 25 to 29 years
In terms of unemployment among ages 25 to 29 years, the demographic groups most similar to Scotch-Irish are Immigrants from England (6.8%, a difference of 0.010%), Ugandan (6.8%, a difference of 0.020%), Immigrants from Denmark (6.8%, a difference of 0.090%), Immigrants from Germany (6.8%, a difference of 0.11%), and Immigrants from Norway (6.8%, a difference of 0.12%).
| Demographics | Rating | Rank | Unemployment Among Ages 25 to 29 years |
| Italians | 26.5 /100 | #197 | Fair 6.8% |
| Immigrants | Southern Europe | 24.6 /100 | #198 | Fair 6.8% |
| Guamanians/Chamorros | 24.3 /100 | #199 | Fair 6.8% |
| South American Indians | 23.3 /100 | #200 | Fair 6.8% |
| Basques | 22.5 /100 | #201 | Fair 6.8% |
| Immigrants | Argentina | 21.6 /100 | #202 | Fair 6.8% |
| Immigrants | Norway | 21.2 /100 | #203 | Fair 6.8% |
| Scotch-Irish | 20.0 /100 | #204 | Poor 6.8% |
| Immigrants | England | 19.8 /100 | #205 | Poor 6.8% |
| Ugandans | 19.8 /100 | #206 | Poor 6.8% |
| Immigrants | Denmark | 19.0 /100 | #207 | Poor 6.8% |
| Immigrants | Germany | 18.8 /100 | #208 | Poor 6.8% |
| Hawaiians | 17.1 /100 | #209 | Poor 6.8% |
| Canadians | 16.9 /100 | #210 | Poor 6.8% |
| Immigrants | Philippines | 16.7 /100 | #211 | Poor 6.8% |
Demographics Similar to Sub-Saharan Africans by Unemployment Among Ages 25 to 29 years
In terms of unemployment among ages 25 to 29 years, the demographic groups most similar to Sub-Saharan Africans are Seminole (7.2%, a difference of 0.020%), Immigrants from Guatemala (7.2%, a difference of 0.17%), Immigrants from Uzbekistan (7.2%, a difference of 0.18%), Delaware (7.2%, a difference of 0.19%), and Portuguese (7.2%, a difference of 0.25%).
| Demographics | Rating | Rank | Unemployment Among Ages 25 to 29 years |
| Immigrants | Sierra Leone | 1.3 /100 | #241 | Tragic 7.1% |
| Spanish American Indians | 1.1 /100 | #242 | Tragic 7.1% |
| Yaqui | 1.0 /100 | #243 | Tragic 7.1% |
| Immigrants | Nonimmigrants | 0.9 /100 | #244 | Tragic 7.1% |
| Guatemalans | 0.9 /100 | #245 | Tragic 7.1% |
| Immigrants | Uzbekistan | 0.7 /100 | #246 | Tragic 7.2% |
| Immigrants | Guatemala | 0.7 /100 | #247 | Tragic 7.2% |
| Sub-Saharan Africans | 0.6 /100 | #248 | Tragic 7.2% |
| Seminole | 0.6 /100 | #249 | Tragic 7.2% |
| Delaware | 0.5 /100 | #250 | Tragic 7.2% |
| Portuguese | 0.5 /100 | #251 | Tragic 7.2% |
| Sierra Leoneans | 0.4 /100 | #252 | Tragic 7.2% |
| Immigrants | Portugal | 0.3 /100 | #253 | Tragic 7.2% |
| Ghanaians | 0.3 /100 | #254 | Tragic 7.2% |
| Immigrants | Cameroon | 0.3 /100 | #255 | Tragic 7.2% |