Scotch-Irish vs Spaniard Unemployment
COMPARE
Scotch-Irish
Spaniard
Unemployment
Unemployment Comparison
Scotch-Irish
Spaniards
4.8%
UNEMPLOYMENT
99.8/ 100
METRIC RATING
35th/ 347
METRIC RANK
5.3%
UNEMPLOYMENT
42.2/ 100
METRIC RATING
182nd/ 347
METRIC RANK
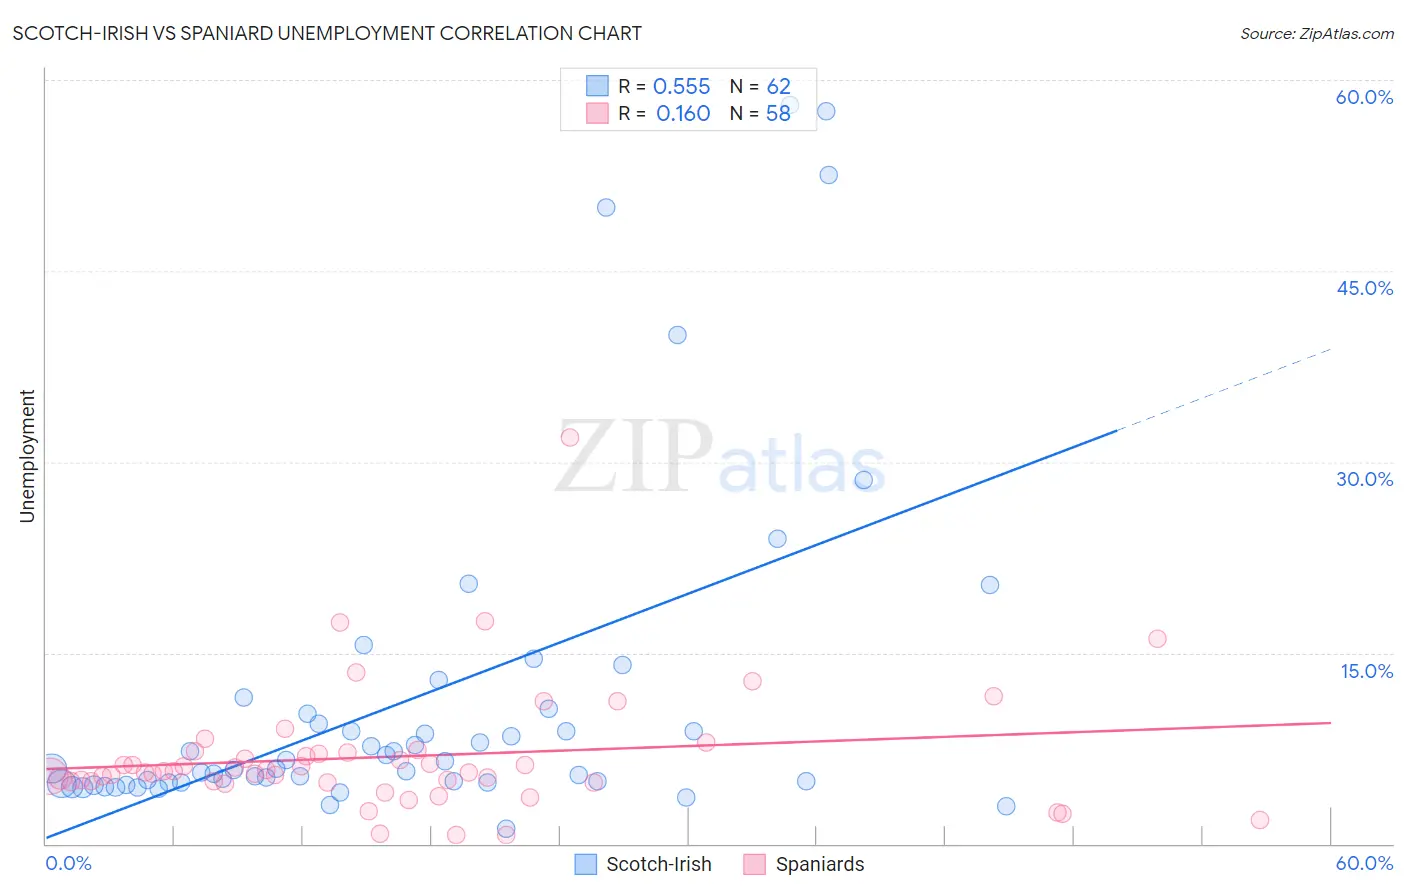
Scotch-Irish vs Spaniard Unemployment Correlation Chart
The statistical analysis conducted on geographies consisting of 545,559,279 people shows a substantial positive correlation between the proportion of Scotch-Irish and unemployment in the United States with a correlation coefficient (R) of 0.555 and weighted average of 4.8%. Similarly, the statistical analysis conducted on geographies consisting of 442,859,385 people shows a poor positive correlation between the proportion of Spaniards and unemployment in the United States with a correlation coefficient (R) of 0.160 and weighted average of 5.3%, a difference of 10.8%.
Unemployment Correlation Summary
| Measurement | Scotch-Irish | Spaniard |
| Minimum | 1.2% | 0.70% |
| Maximum | 58.0% | 31.9% |
| Range | 56.8% | 31.2% |
| Mean | 11.3% | 6.8% |
| Median | 5.9% | 5.7% |
| Interquartile 25% (IQ1) | 4.8% | 4.9% |
| Interquartile 75% (IQ3) | 10.2% | 7.2% |
| Interquartile Range (IQR) | 5.4% | 2.3% |
| Standard Deviation (Sample) | 13.2% | 4.9% |
| Standard Deviation (Population) | 13.1% | 4.9% |
Similar Demographics by Unemployment
Demographics Similar to Scotch-Irish by Unemployment
In terms of unemployment, the demographic groups most similar to Scotch-Irish are Immigrants from Bolivia (4.8%, a difference of 0.070%), Sudanese (4.8%, a difference of 0.11%), Zimbabwean (4.8%, a difference of 0.12%), Croatian (4.8%, a difference of 0.22%), and Tongan (4.8%, a difference of 0.22%).
| Demographics | Rating | Rank | Unemployment |
| Cubans | 99.8 /100 | #28 | Exceptional 4.7% |
| Poles | 99.8 /100 | #29 | Exceptional 4.7% |
| Irish | 99.8 /100 | #30 | Exceptional 4.8% |
| Croatians | 99.8 /100 | #31 | Exceptional 4.8% |
| Zimbabweans | 99.8 /100 | #32 | Exceptional 4.8% |
| Sudanese | 99.8 /100 | #33 | Exceptional 4.8% |
| Immigrants | Bolivia | 99.8 /100 | #34 | Exceptional 4.8% |
| Scotch-Irish | 99.8 /100 | #35 | Exceptional 4.8% |
| Tongans | 99.7 /100 | #36 | Exceptional 4.8% |
| Czechoslovakians | 99.7 /100 | #37 | Exceptional 4.8% |
| Bolivians | 99.7 /100 | #38 | Exceptional 4.8% |
| Lithuanians | 99.7 /100 | #39 | Exceptional 4.8% |
| Northern Europeans | 99.7 /100 | #40 | Exceptional 4.8% |
| Immigrants | Bosnia and Herzegovina | 99.7 /100 | #41 | Exceptional 4.8% |
| Filipinos | 99.5 /100 | #42 | Exceptional 4.8% |
Demographics Similar to Spaniards by Unemployment
In terms of unemployment, the demographic groups most similar to Spaniards are Albanian (5.3%, a difference of 0.080%), Brazilian (5.3%, a difference of 0.13%), Immigrants from Greece (5.3%, a difference of 0.18%), Assyrian/Chaldean/Syriac (5.3%, a difference of 0.19%), and Immigrants from Thailand (5.3%, a difference of 0.21%).
| Demographics | Rating | Rank | Unemployment |
| Taiwanese | 49.6 /100 | #175 | Average 5.3% |
| Nicaraguans | 48.7 /100 | #176 | Average 5.3% |
| Immigrants | Nonimmigrants | 47.9 /100 | #177 | Average 5.3% |
| Afghans | 47.4 /100 | #178 | Average 5.3% |
| Malaysians | 46.8 /100 | #179 | Average 5.3% |
| Immigrants | Greece | 45.0 /100 | #180 | Average 5.3% |
| Albanians | 43.5 /100 | #181 | Average 5.3% |
| Spaniards | 42.2 /100 | #182 | Average 5.3% |
| Brazilians | 40.2 /100 | #183 | Average 5.3% |
| Assyrians/Chaldeans/Syriacs | 39.2 /100 | #184 | Fair 5.3% |
| Immigrants | Thailand | 38.9 /100 | #185 | Fair 5.3% |
| Immigrants | Uganda | 37.8 /100 | #186 | Fair 5.3% |
| Costa Ricans | 37.4 /100 | #187 | Fair 5.3% |
| Alsatians | 37.0 /100 | #188 | Fair 5.3% |
| Immigrants | Belarus | 35.6 /100 | #189 | Fair 5.3% |