Scotch-Irish vs Latvian Unemployment Among Youth under 25 years
COMPARE
Scotch-Irish
Latvian
Unemployment Among Youth under 25 years
Unemployment Among Youth under 25 years Comparison
Scotch-Irish
Latvians
11.1%
UNEMPLOYMENT AMONG YOUTH UNDER 25 YEARS
98.8/ 100
METRIC RATING
58th/ 347
METRIC RANK
11.0%
UNEMPLOYMENT AMONG YOUTH UNDER 25 YEARS
99.0/ 100
METRIC RATING
52nd/ 347
METRIC RANK
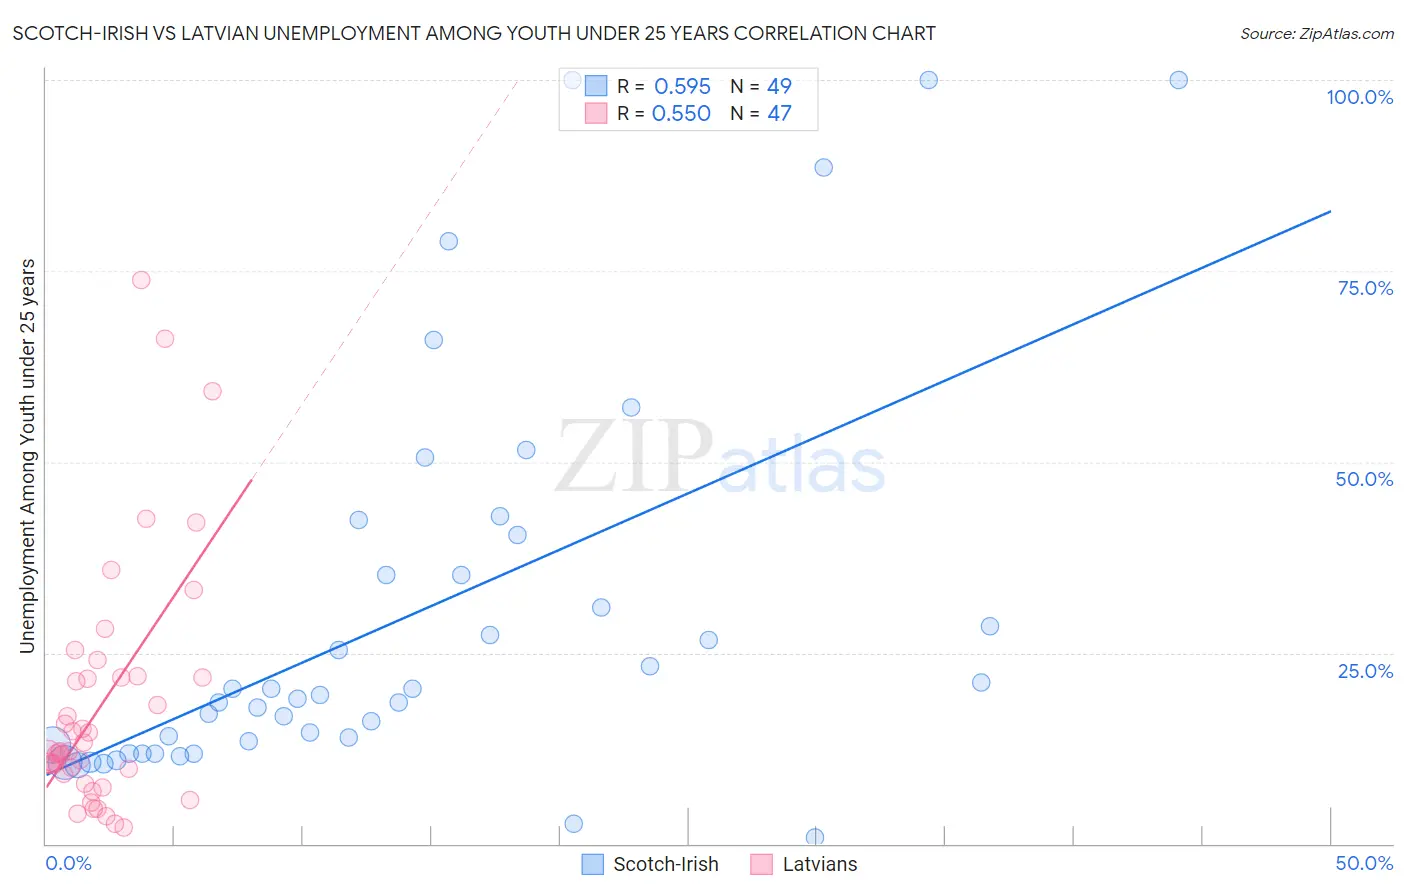
Scotch-Irish vs Latvian Unemployment Among Youth under 25 years Correlation Chart
The statistical analysis conducted on geographies consisting of 527,464,403 people shows a substantial positive correlation between the proportion of Scotch-Irish and unemployment rate among youth under the age of 25 in the United States with a correlation coefficient (R) of 0.595 and weighted average of 11.1%. Similarly, the statistical analysis conducted on geographies consisting of 218,853,082 people shows a substantial positive correlation between the proportion of Latvians and unemployment rate among youth under the age of 25 in the United States with a correlation coefficient (R) of 0.550 and weighted average of 11.0%, a difference of 0.25%.
Unemployment Among Youth under 25 years Correlation Summary
| Measurement | Scotch-Irish | Latvian |
| Minimum | 0.80% | 2.1% |
| Maximum | 100.0% | 73.8% |
| Range | 99.2% | 71.7% |
| Mean | 29.8% | 18.2% |
| Median | 19.4% | 12.1% |
| Interquartile 25% (IQ1) | 12.4% | 9.1% |
| Interquartile 75% (IQ3) | 37.9% | 21.8% |
| Interquartile Range (IQR) | 25.5% | 12.7% |
| Standard Deviation (Sample) | 25.8% | 16.0% |
| Standard Deviation (Population) | 25.6% | 15.8% |
Demographics Similar to Scotch-Irish and Latvians by Unemployment Among Youth under 25 years
In terms of unemployment among youth under 25 years, the demographic groups most similar to Scotch-Irish are Immigrants from Eritrea (11.1%, a difference of 0.040%), Immigrants from Saudi Arabia (11.1%, a difference of 0.050%), Immigrants from Eastern Africa (11.1%, a difference of 0.060%), Mongolian (11.1%, a difference of 0.070%), and Irish (11.1%, a difference of 0.070%). Similarly, the demographic groups most similar to Latvians are Serbian (11.0%, a difference of 0.020%), Ottawa (11.1%, a difference of 0.090%), Mongolian (11.1%, a difference of 0.17%), Irish (11.1%, a difference of 0.17%), and Immigrants from Saudi Arabia (11.1%, a difference of 0.20%).
| Demographics | Rating | Rank | Unemployment Among Youth under 25 years |
| Bulgarians | 99.6 /100 | #45 | Exceptional 10.9% |
| Tongans | 99.6 /100 | #46 | Exceptional 10.9% |
| Australians | 99.6 /100 | #47 | Exceptional 10.9% |
| Poles | 99.3 /100 | #48 | Exceptional 11.0% |
| Thais | 99.3 /100 | #49 | Exceptional 11.0% |
| Czechoslovakians | 99.2 /100 | #50 | Exceptional 11.0% |
| Serbians | 99.0 /100 | #51 | Exceptional 11.0% |
| Latvians | 99.0 /100 | #52 | Exceptional 11.0% |
| Ottawa | 99.0 /100 | #53 | Exceptional 11.1% |
| Mongolians | 98.9 /100 | #54 | Exceptional 11.1% |
| Irish | 98.9 /100 | #55 | Exceptional 11.1% |
| Immigrants | Saudi Arabia | 98.8 /100 | #56 | Exceptional 11.1% |
| Immigrants | Eritrea | 98.8 /100 | #57 | Exceptional 11.1% |
| Scotch-Irish | 98.8 /100 | #58 | Exceptional 11.1% |
| Immigrants | Eastern Africa | 98.7 /100 | #59 | Exceptional 11.1% |
| South Africans | 98.5 /100 | #60 | Exceptional 11.1% |
| Filipinos | 98.3 /100 | #61 | Exceptional 11.1% |
| Immigrants | Netherlands | 98.1 /100 | #62 | Exceptional 11.1% |
| Immigrants | Croatia | 98.1 /100 | #63 | Exceptional 11.1% |
| Jordanians | 97.9 /100 | #64 | Exceptional 11.1% |
| Immigrants | Singapore | 97.8 /100 | #65 | Exceptional 11.2% |