Immigrants from Peru vs Latvian Disability Age Over 75
COMPARE
Immigrants from Peru
Latvian
Disability Age Over 75
Disability Age Over 75 Comparison
Immigrants from Peru
Latvians
46.9%
DISABILITY AGE OVER 75
84.1/ 100
METRIC RATING
147th/ 347
METRIC RANK
45.1%
DISABILITY AGE OVER 75
100.0/ 100
METRIC RATING
13th/ 347
METRIC RANK
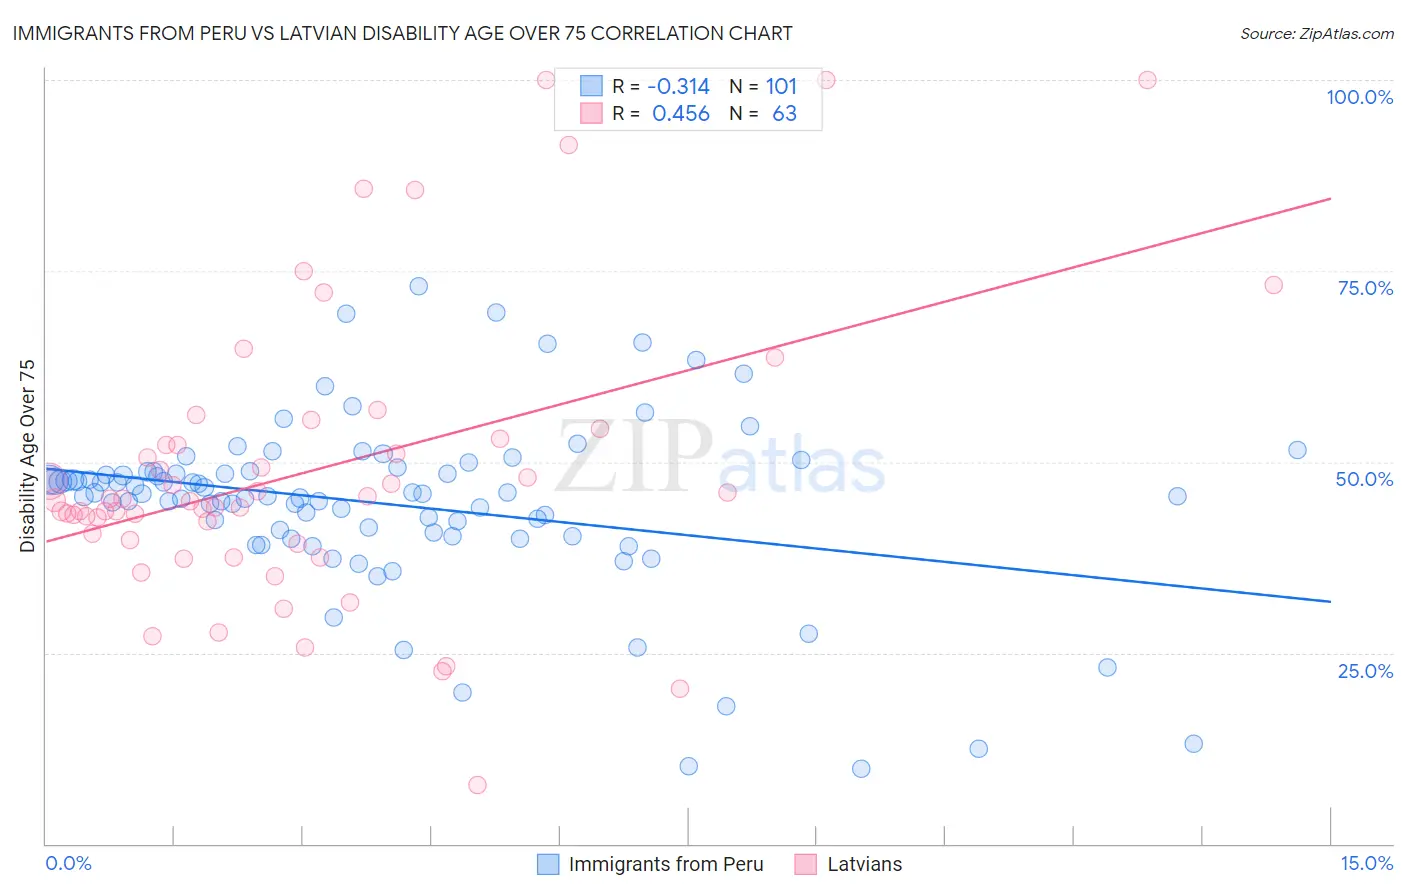
Immigrants from Peru vs Latvian Disability Age Over 75 Correlation Chart
The statistical analysis conducted on geographies consisting of 328,503,391 people shows a mild negative correlation between the proportion of Immigrants from Peru and percentage of population with a disability over the age of 75 in the United States with a correlation coefficient (R) of -0.314 and weighted average of 46.9%. Similarly, the statistical analysis conducted on geographies consisting of 220,463,619 people shows a moderate positive correlation between the proportion of Latvians and percentage of population with a disability over the age of 75 in the United States with a correlation coefficient (R) of 0.456 and weighted average of 45.1%, a difference of 4.0%.
Disability Age Over 75 Correlation Summary
| Measurement | Immigrants from Peru | Latvian |
| Minimum | 9.9% | 7.7% |
| Maximum | 73.0% | 100.0% |
| Range | 63.1% | 92.3% |
| Mean | 44.5% | 48.9% |
| Median | 45.8% | 44.9% |
| Interquartile 25% (IQ1) | 40.6% | 39.7% |
| Interquartile 75% (IQ3) | 48.7% | 53.1% |
| Interquartile Range (IQR) | 8.1% | 13.3% |
| Standard Deviation (Sample) | 11.5% | 19.0% |
| Standard Deviation (Population) | 11.4% | 18.8% |
Similar Demographics by Disability Age Over 75
Demographics Similar to Immigrants from Peru by Disability Age Over 75
In terms of disability age over 75, the demographic groups most similar to Immigrants from Peru are Guyanese (46.9%, a difference of 0.010%), Costa Rican (46.9%, a difference of 0.020%), Venezuelan (46.9%, a difference of 0.040%), Bermudan (46.9%, a difference of 0.070%), and Asian (46.9%, a difference of 0.10%).
| Demographics | Rating | Rank | Disability Age Over 75 |
| Immigrants | Costa Rica | 87.4 /100 | #140 | Excellent 46.8% |
| Lebanese | 87.0 /100 | #141 | Excellent 46.8% |
| Peruvians | 86.5 /100 | #142 | Excellent 46.8% |
| Bermudans | 85.6 /100 | #143 | Excellent 46.9% |
| Venezuelans | 85.0 /100 | #144 | Excellent 46.9% |
| Costa Ricans | 84.5 /100 | #145 | Excellent 46.9% |
| Guyanese | 84.3 /100 | #146 | Excellent 46.9% |
| Immigrants | Peru | 84.1 /100 | #147 | Excellent 46.9% |
| Asians | 81.6 /100 | #148 | Excellent 46.9% |
| Welsh | 81.3 /100 | #149 | Excellent 47.0% |
| Immigrants | Russia | 79.3 /100 | #150 | Good 47.0% |
| French Canadians | 79.0 /100 | #151 | Good 47.0% |
| Immigrants | Asia | 76.5 /100 | #152 | Good 47.0% |
| Immigrants | Zaire | 74.8 /100 | #153 | Good 47.1% |
| Immigrants | Belarus | 74.8 /100 | #154 | Good 47.1% |
Demographics Similar to Latvians by Disability Age Over 75
In terms of disability age over 75, the demographic groups most similar to Latvians are Immigrants from Czechoslovakia (45.1%, a difference of 0.010%), Immigrants from Scotland (45.1%, a difference of 0.010%), Immigrants from Sweden (45.1%, a difference of 0.050%), Lithuanian (45.1%, a difference of 0.10%), and Bulgarian (45.1%, a difference of 0.15%).
| Demographics | Rating | Rank | Disability Age Over 75 |
| Immigrants | Lithuania | 100.0 /100 | #6 | Exceptional 44.9% |
| Okinawans | 100.0 /100 | #7 | Exceptional 44.9% |
| Immigrants | Austria | 100.0 /100 | #8 | Exceptional 44.9% |
| Paraguayans | 100.0 /100 | #9 | Exceptional 45.0% |
| Bulgarians | 100.0 /100 | #10 | Exceptional 45.1% |
| Lithuanians | 100.0 /100 | #11 | Exceptional 45.1% |
| Immigrants | Czechoslovakia | 100.0 /100 | #12 | Exceptional 45.1% |
| Latvians | 100.0 /100 | #13 | Exceptional 45.1% |
| Immigrants | Scotland | 100.0 /100 | #14 | Exceptional 45.1% |
| Immigrants | Sweden | 100.0 /100 | #15 | Exceptional 45.1% |
| Immigrants | Northern Europe | 100.0 /100 | #16 | Exceptional 45.2% |
| Immigrants | India | 100.0 /100 | #17 | Exceptional 45.2% |
| Bolivians | 100.0 /100 | #18 | Exceptional 45.2% |
| Immigrants | Greece | 100.0 /100 | #19 | Exceptional 45.2% |
| Immigrants | Serbia | 100.0 /100 | #20 | Exceptional 45.3% |