Japanese vs Immigrants from Europe Ambulatory Disability
COMPARE
Japanese
Immigrants from Europe
Ambulatory Disability
Ambulatory Disability Comparison
Japanese
Immigrants from Europe
6.3%
AMBULATORY DISABILITY
12.0/ 100
METRIC RATING
213th/ 347
METRIC RANK
6.0%
AMBULATORY DISABILITY
87.8/ 100
METRIC RATING
132nd/ 347
METRIC RANK
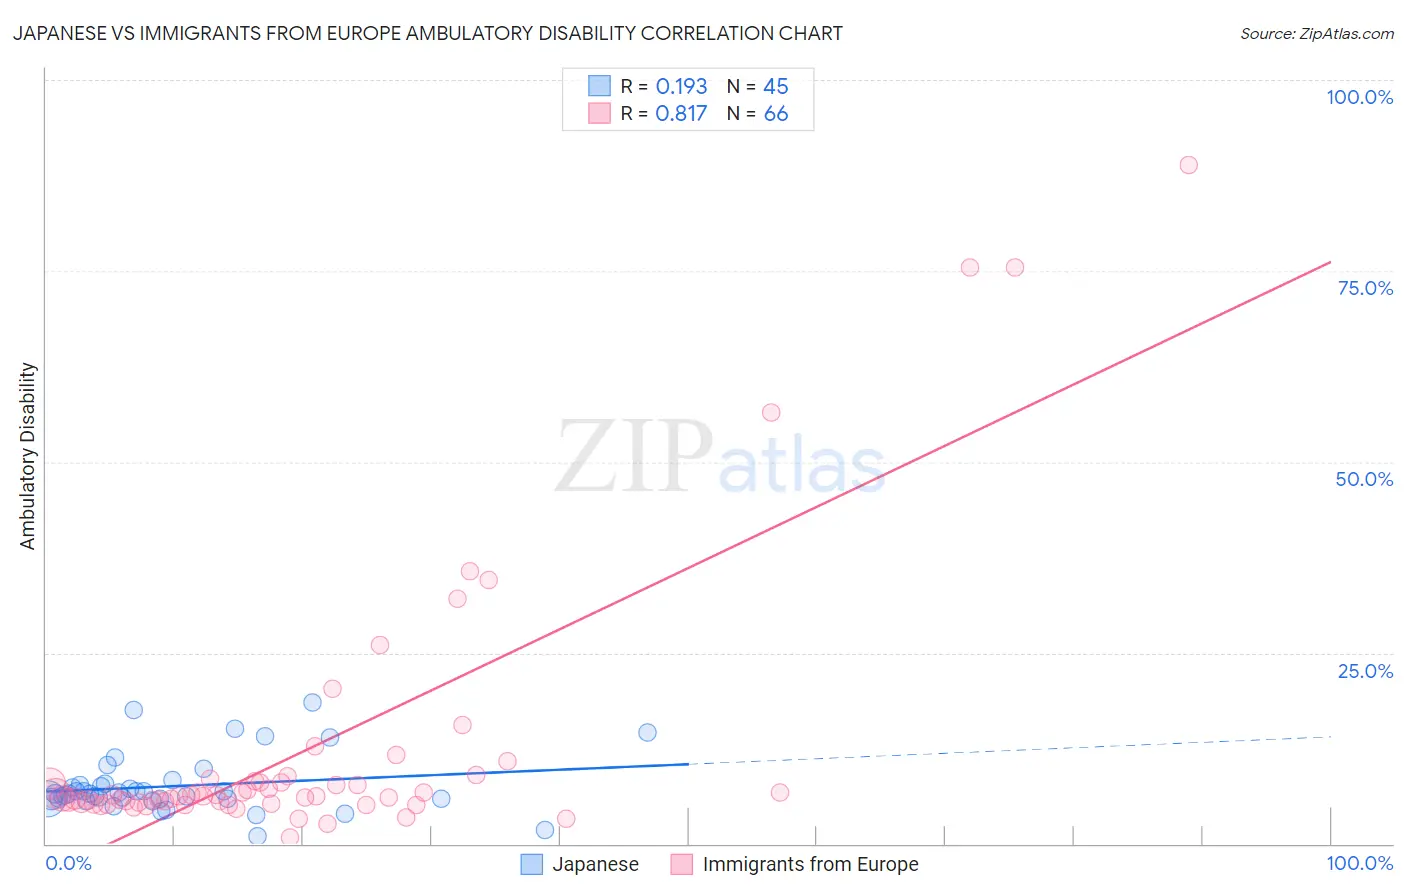
Japanese vs Immigrants from Europe Ambulatory Disability Correlation Chart
The statistical analysis conducted on geographies consisting of 249,121,214 people shows a poor positive correlation between the proportion of Japanese and percentage of population with ambulatory disability in the United States with a correlation coefficient (R) of 0.193 and weighted average of 6.3%. Similarly, the statistical analysis conducted on geographies consisting of 547,017,856 people shows a very strong positive correlation between the proportion of Immigrants from Europe and percentage of population with ambulatory disability in the United States with a correlation coefficient (R) of 0.817 and weighted average of 6.0%, a difference of 5.4%.
Ambulatory Disability Correlation Summary
| Measurement | Japanese | Immigrants from Europe |
| Minimum | 0.93% | 0.74% |
| Maximum | 18.5% | 88.9% |
| Range | 17.6% | 88.1% |
| Mean | 7.5% | 12.3% |
| Median | 6.5% | 6.2% |
| Interquartile 25% (IQ1) | 5.8% | 5.4% |
| Interquartile 75% (IQ3) | 7.7% | 8.2% |
| Interquartile Range (IQR) | 1.9% | 2.8% |
| Standard Deviation (Sample) | 3.7% | 17.4% |
| Standard Deviation (Population) | 3.7% | 17.3% |
Similar Demographics by Ambulatory Disability
Demographics Similar to Japanese by Ambulatory Disability
In terms of ambulatory disability, the demographic groups most similar to Japanese are Mexican American Indian (6.3%, a difference of 0.0%), Samoan (6.3%, a difference of 0.010%), Immigrants from Mexico (6.3%, a difference of 0.12%), Immigrants from Latin America (6.3%, a difference of 0.13%), and Canadian (6.3%, a difference of 0.14%).
| Demographics | Rating | Rank | Ambulatory Disability |
| Finns | 17.2 /100 | #206 | Poor 6.2% |
| Alsatians | 15.1 /100 | #207 | Poor 6.3% |
| Bangladeshis | 14.2 /100 | #208 | Poor 6.3% |
| Immigrants | Iraq | 14.0 /100 | #209 | Poor 6.3% |
| Immigrants | Laos | 13.2 /100 | #210 | Poor 6.3% |
| Samoans | 12.1 /100 | #211 | Poor 6.3% |
| Mexican American Indians | 12.0 /100 | #212 | Poor 6.3% |
| Japanese | 12.0 /100 | #213 | Poor 6.3% |
| Immigrants | Mexico | 11.0 /100 | #214 | Poor 6.3% |
| Immigrants | Latin America | 11.0 /100 | #215 | Poor 6.3% |
| Canadians | 10.9 /100 | #216 | Poor 6.3% |
| Yugoslavians | 10.9 /100 | #217 | Poor 6.3% |
| Guamanians/Chamorros | 10.6 /100 | #218 | Poor 6.3% |
| Indonesians | 9.9 /100 | #219 | Tragic 6.3% |
| Immigrants | Albania | 9.6 /100 | #220 | Tragic 6.3% |
Demographics Similar to Immigrants from Europe by Ambulatory Disability
In terms of ambulatory disability, the demographic groups most similar to Immigrants from Europe are Immigrants (6.0%, a difference of 0.11%), Ute (6.0%, a difference of 0.15%), Immigrants from Costa Rica (5.9%, a difference of 0.24%), Immigrants from Kazakhstan (5.9%, a difference of 0.27%), and Immigrants from Italy (6.0%, a difference of 0.32%).
| Demographics | Rating | Rank | Ambulatory Disability |
| Koreans | 91.6 /100 | #125 | Exceptional 5.9% |
| Arabs | 91.5 /100 | #126 | Exceptional 5.9% |
| Immigrants | Nigeria | 90.9 /100 | #127 | Exceptional 5.9% |
| Immigrants | Western Asia | 90.7 /100 | #128 | Exceptional 5.9% |
| Immigrants | Norway | 90.5 /100 | #129 | Exceptional 5.9% |
| Immigrants | Kazakhstan | 89.7 /100 | #130 | Excellent 5.9% |
| Immigrants | Costa Rica | 89.5 /100 | #131 | Excellent 5.9% |
| Immigrants | Europe | 87.8 /100 | #132 | Excellent 6.0% |
| Immigrants | Immigrants | 86.9 /100 | #133 | Excellent 6.0% |
| Ute | 86.6 /100 | #134 | Excellent 6.0% |
| Immigrants | Italy | 85.0 /100 | #135 | Excellent 6.0% |
| Immigrants | North Macedonia | 84.1 /100 | #136 | Excellent 6.0% |
| Immigrants | Syria | 84.1 /100 | #137 | Excellent 6.0% |
| Immigrants | Hungary | 83.9 /100 | #138 | Excellent 6.0% |
| Immigrants | Zaire | 83.6 /100 | #139 | Excellent 6.0% |