Armenian vs Immigrants from Europe Ambulatory Disability
COMPARE
Armenian
Immigrants from Europe
Ambulatory Disability
Ambulatory Disability Comparison
Armenians
Immigrants from Europe
6.5%
AMBULATORY DISABILITY
1.5/ 100
METRIC RATING
246th/ 347
METRIC RANK
6.0%
AMBULATORY DISABILITY
87.8/ 100
METRIC RATING
132nd/ 347
METRIC RANK
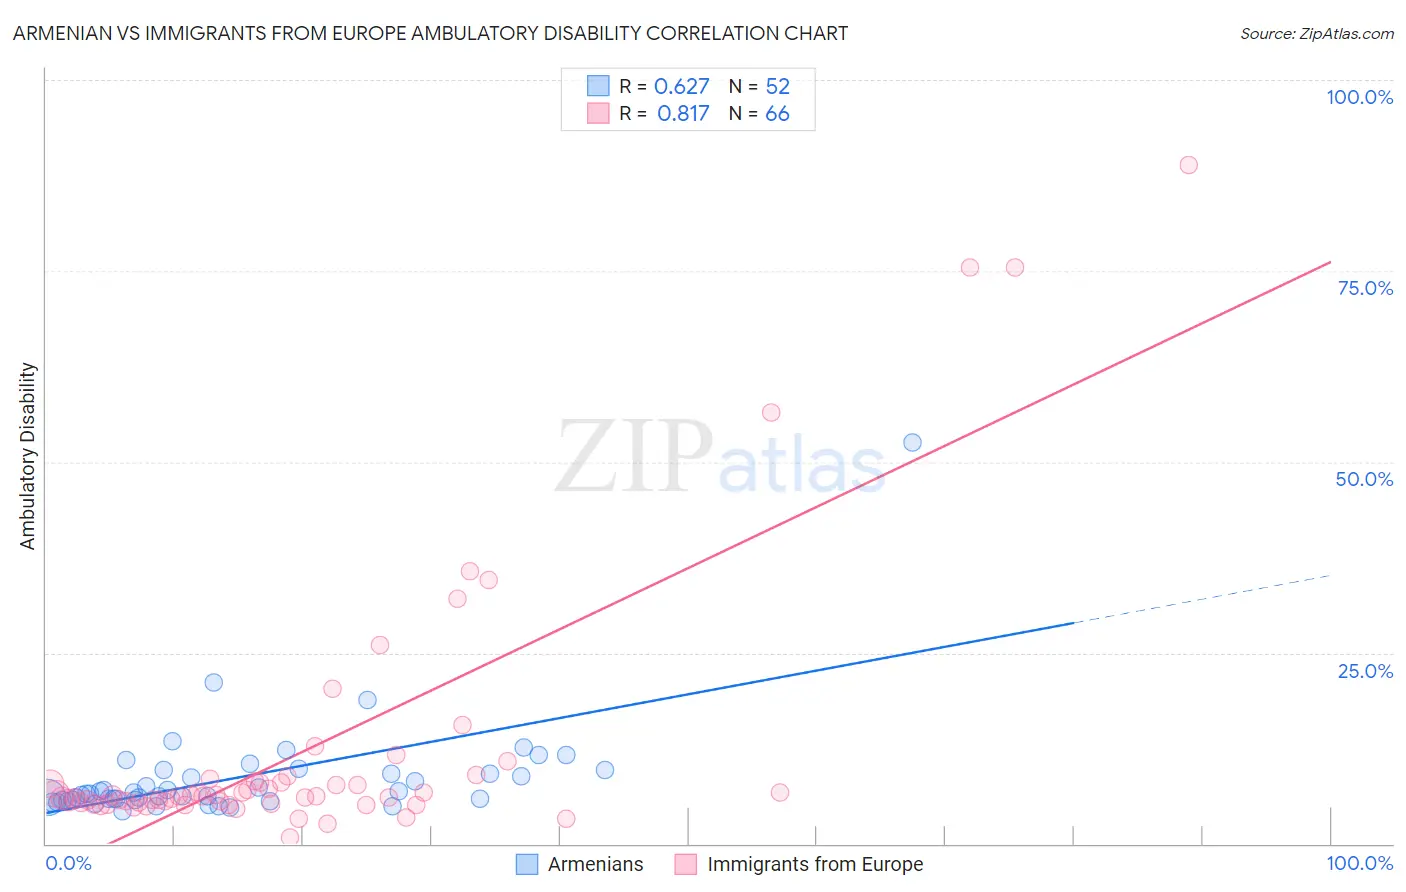
Armenian vs Immigrants from Europe Ambulatory Disability Correlation Chart
The statistical analysis conducted on geographies consisting of 310,863,857 people shows a significant positive correlation between the proportion of Armenians and percentage of population with ambulatory disability in the United States with a correlation coefficient (R) of 0.627 and weighted average of 6.5%. Similarly, the statistical analysis conducted on geographies consisting of 547,017,856 people shows a very strong positive correlation between the proportion of Immigrants from Europe and percentage of population with ambulatory disability in the United States with a correlation coefficient (R) of 0.817 and weighted average of 6.0%, a difference of 8.4%.
Ambulatory Disability Correlation Summary
| Measurement | Armenian | Immigrants from Europe |
| Minimum | 4.2% | 0.74% |
| Maximum | 52.5% | 88.9% |
| Range | 48.3% | 88.1% |
| Mean | 8.7% | 12.3% |
| Median | 6.6% | 6.2% |
| Interquartile 25% (IQ1) | 5.7% | 5.4% |
| Interquartile 75% (IQ3) | 9.4% | 8.2% |
| Interquartile Range (IQR) | 3.7% | 2.8% |
| Standard Deviation (Sample) | 7.0% | 17.4% |
| Standard Deviation (Population) | 7.0% | 17.3% |
Similar Demographics by Ambulatory Disability
Demographics Similar to Armenians by Ambulatory Disability
In terms of ambulatory disability, the demographic groups most similar to Armenians are Tlingit-Haida (6.5%, a difference of 0.020%), German (6.5%, a difference of 0.050%), Immigrants from Panama (6.5%, a difference of 0.050%), Immigrants from Cuba (6.5%, a difference of 0.050%), and Spaniard (6.5%, a difference of 0.070%).
| Demographics | Rating | Rank | Ambulatory Disability |
| Senegalese | 1.7 /100 | #239 | Tragic 6.4% |
| Immigrants | Senegal | 1.7 /100 | #240 | Tragic 6.4% |
| Immigrants | Haiti | 1.6 /100 | #241 | Tragic 6.5% |
| Spaniards | 1.6 /100 | #242 | Tragic 6.5% |
| Germans | 1.5 /100 | #243 | Tragic 6.5% |
| Immigrants | Panama | 1.5 /100 | #244 | Tragic 6.5% |
| Tlingit-Haida | 1.5 /100 | #245 | Tragic 6.5% |
| Armenians | 1.5 /100 | #246 | Tragic 6.5% |
| Immigrants | Cuba | 1.4 /100 | #247 | Tragic 6.5% |
| Immigrants | Portugal | 1.4 /100 | #248 | Tragic 6.5% |
| Native Hawaiians | 1.1 /100 | #249 | Tragic 6.5% |
| Chinese | 1.0 /100 | #250 | Tragic 6.5% |
| Hawaiians | 0.9 /100 | #251 | Tragic 6.5% |
| Immigrants | Bahamas | 0.8 /100 | #252 | Tragic 6.5% |
| Scottish | 0.7 /100 | #253 | Tragic 6.5% |
Demographics Similar to Immigrants from Europe by Ambulatory Disability
In terms of ambulatory disability, the demographic groups most similar to Immigrants from Europe are Immigrants (6.0%, a difference of 0.11%), Ute (6.0%, a difference of 0.15%), Immigrants from Costa Rica (5.9%, a difference of 0.24%), Immigrants from Kazakhstan (5.9%, a difference of 0.27%), and Immigrants from Italy (6.0%, a difference of 0.32%).
| Demographics | Rating | Rank | Ambulatory Disability |
| Koreans | 91.6 /100 | #125 | Exceptional 5.9% |
| Arabs | 91.5 /100 | #126 | Exceptional 5.9% |
| Immigrants | Nigeria | 90.9 /100 | #127 | Exceptional 5.9% |
| Immigrants | Western Asia | 90.7 /100 | #128 | Exceptional 5.9% |
| Immigrants | Norway | 90.5 /100 | #129 | Exceptional 5.9% |
| Immigrants | Kazakhstan | 89.7 /100 | #130 | Excellent 5.9% |
| Immigrants | Costa Rica | 89.5 /100 | #131 | Excellent 5.9% |
| Immigrants | Europe | 87.8 /100 | #132 | Excellent 6.0% |
| Immigrants | Immigrants | 86.9 /100 | #133 | Excellent 6.0% |
| Ute | 86.6 /100 | #134 | Excellent 6.0% |
| Immigrants | Italy | 85.0 /100 | #135 | Excellent 6.0% |
| Immigrants | North Macedonia | 84.1 /100 | #136 | Excellent 6.0% |
| Immigrants | Syria | 84.1 /100 | #137 | Excellent 6.0% |
| Immigrants | Hungary | 83.9 /100 | #138 | Excellent 6.0% |
| Immigrants | Zaire | 83.6 /100 | #139 | Excellent 6.0% |