Japanese vs Immigrants from Europe Female Poverty
COMPARE
Japanese
Immigrants from Europe
Female Poverty
Female Poverty Comparison
Japanese
Immigrants from Europe
14.5%
FEMALE POVERTY
4.1/ 100
METRIC RATING
219th/ 347
METRIC RANK
12.1%
FEMALE POVERTY
98.2/ 100
METRIC RATING
59th/ 347
METRIC RANK
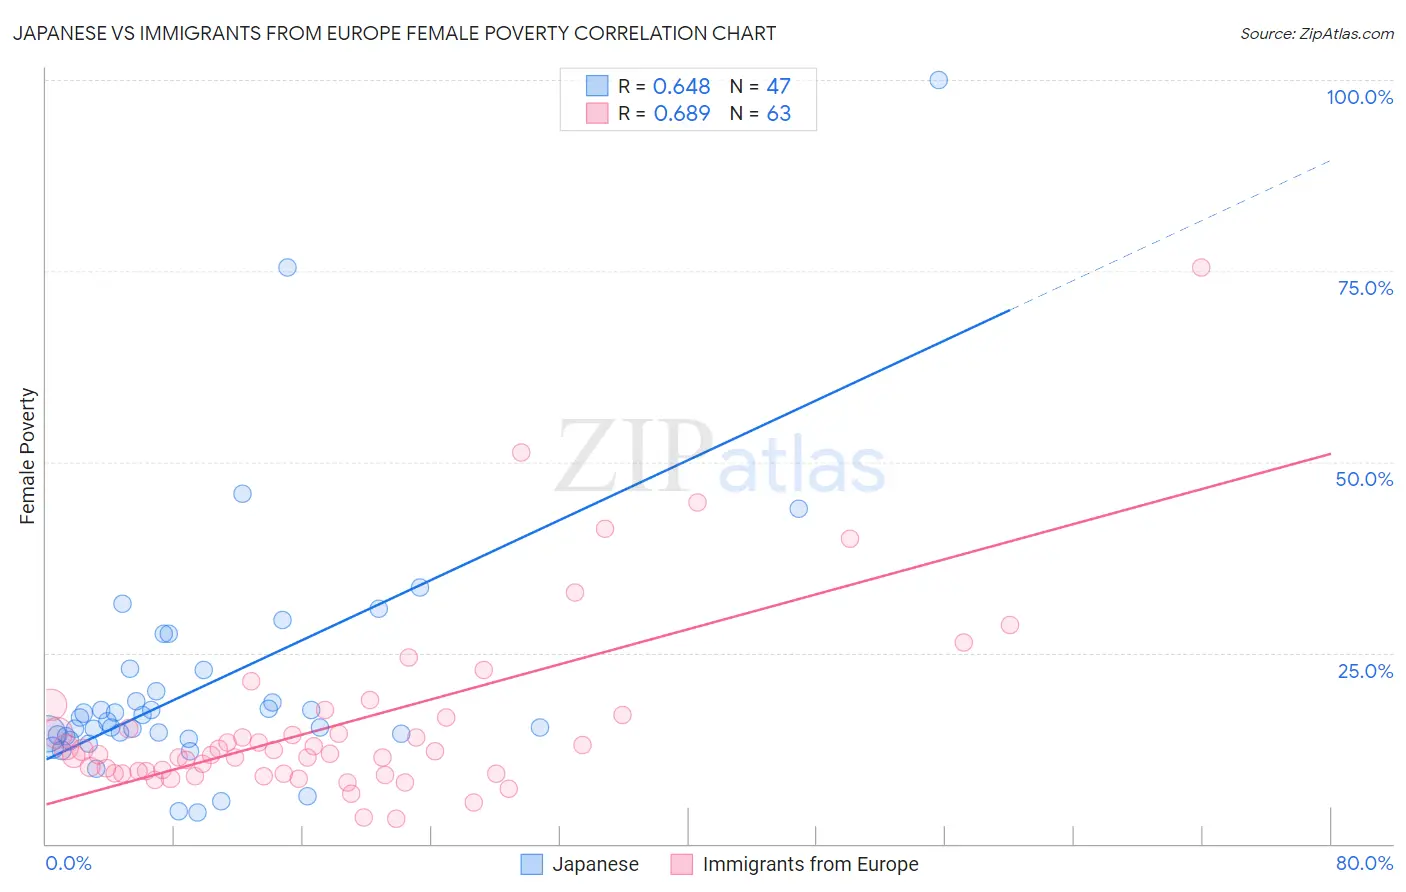
Japanese vs Immigrants from Europe Female Poverty Correlation Chart
The statistical analysis conducted on geographies consisting of 249,060,032 people shows a significant positive correlation between the proportion of Japanese and poverty level among females in the United States with a correlation coefficient (R) of 0.648 and weighted average of 14.5%. Similarly, the statistical analysis conducted on geographies consisting of 546,481,201 people shows a significant positive correlation between the proportion of Immigrants from Europe and poverty level among females in the United States with a correlation coefficient (R) of 0.689 and weighted average of 12.1%, a difference of 19.1%.
Female Poverty Correlation Summary
| Measurement | Japanese | Immigrants from Europe |
| Minimum | 4.1% | 3.3% |
| Maximum | 100.0% | 75.4% |
| Range | 95.9% | 72.1% |
| Mean | 21.0% | 15.7% |
| Median | 16.0% | 11.8% |
| Interquartile 25% (IQ1) | 14.2% | 9.2% |
| Interquartile 75% (IQ3) | 22.7% | 16.5% |
| Interquartile Range (IQR) | 8.6% | 7.3% |
| Standard Deviation (Sample) | 16.8% | 12.2% |
| Standard Deviation (Population) | 16.7% | 12.1% |
Similar Demographics by Female Poverty
Demographics Similar to Japanese by Female Poverty
In terms of female poverty, the demographic groups most similar to Japanese are Alsatian (14.5%, a difference of 0.050%), Immigrants from Uzbekistan (14.4%, a difference of 0.14%), Immigrants (14.4%, a difference of 0.19%), Immigrants from Thailand (14.4%, a difference of 0.22%), and Immigrants from Cambodia (14.5%, a difference of 0.24%).
| Demographics | Rating | Rank | Female Poverty |
| Bermudans | 5.5 /100 | #212 | Tragic 14.4% |
| Alaskan Athabascans | 5.3 /100 | #213 | Tragic 14.4% |
| Marshallese | 5.0 /100 | #214 | Tragic 14.4% |
| Immigrants | Panama | 4.7 /100 | #215 | Tragic 14.4% |
| Immigrants | Thailand | 4.5 /100 | #216 | Tragic 14.4% |
| Immigrants | Immigrants | 4.5 /100 | #217 | Tragic 14.4% |
| Immigrants | Uzbekistan | 4.4 /100 | #218 | Tragic 14.4% |
| Japanese | 4.1 /100 | #219 | Tragic 14.5% |
| Alsatians | 4.0 /100 | #220 | Tragic 14.5% |
| Immigrants | Cambodia | 3.7 /100 | #221 | Tragic 14.5% |
| Immigrants | Nonimmigrants | 3.7 /100 | #222 | Tragic 14.5% |
| Immigrants | Africa | 3.3 /100 | #223 | Tragic 14.5% |
| Americans | 2.8 /100 | #224 | Tragic 14.6% |
| Immigrants | Micronesia | 2.8 /100 | #225 | Tragic 14.6% |
| Immigrants | Eritrea | 2.4 /100 | #226 | Tragic 14.6% |
Demographics Similar to Immigrants from Europe by Female Poverty
In terms of female poverty, the demographic groups most similar to Immigrants from Europe are Scandinavian (12.1%, a difference of 0.010%), Immigrants from Serbia (12.1%, a difference of 0.090%), Estonian (12.1%, a difference of 0.15%), Immigrants from Australia (12.2%, a difference of 0.24%), and Immigrants from Asia (12.2%, a difference of 0.25%).
| Demographics | Rating | Rank | Female Poverty |
| Immigrants | Croatia | 98.7 /100 | #52 | Exceptional 12.0% |
| Immigrants | Austria | 98.7 /100 | #53 | Exceptional 12.0% |
| Immigrants | Philippines | 98.7 /100 | #54 | Exceptional 12.1% |
| Immigrants | Sri Lanka | 98.5 /100 | #55 | Exceptional 12.1% |
| Estonians | 98.3 /100 | #56 | Exceptional 12.1% |
| Immigrants | Serbia | 98.3 /100 | #57 | Exceptional 12.1% |
| Scandinavians | 98.2 /100 | #58 | Exceptional 12.1% |
| Immigrants | Europe | 98.2 /100 | #59 | Exceptional 12.1% |
| Immigrants | Australia | 98.1 /100 | #60 | Exceptional 12.2% |
| Immigrants | Asia | 98.1 /100 | #61 | Exceptional 12.2% |
| Immigrants | Italy | 98.0 /100 | #62 | Exceptional 12.2% |
| Ukrainians | 98.0 /100 | #63 | Exceptional 12.2% |
| Germans | 98.0 /100 | #64 | Exceptional 12.2% |
| Indians (Asian) | 97.9 /100 | #65 | Exceptional 12.2% |
| Austrians | 97.9 /100 | #66 | Exceptional 12.2% |