Polish vs Immigrants from Europe Ambulatory Disability
COMPARE
Polish
Immigrants from Europe
Ambulatory Disability
Ambulatory Disability Comparison
Poles
Immigrants from Europe
6.2%
AMBULATORY DISABILITY
26.3/ 100
METRIC RATING
197th/ 347
METRIC RANK
6.0%
AMBULATORY DISABILITY
87.8/ 100
METRIC RATING
132nd/ 347
METRIC RANK
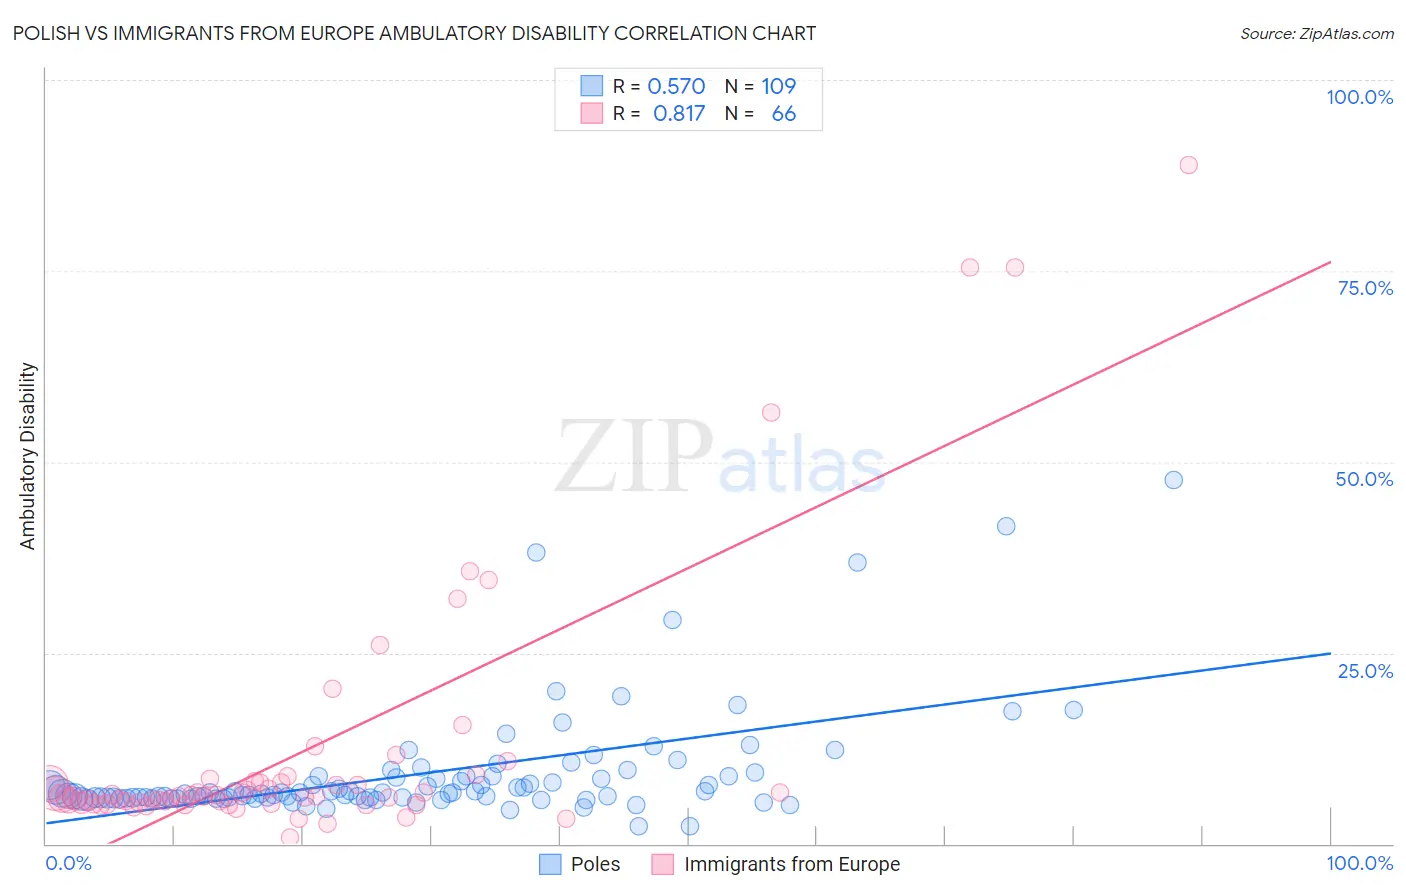
Polish vs Immigrants from Europe Ambulatory Disability Correlation Chart
The statistical analysis conducted on geographies consisting of 560,051,234 people shows a substantial positive correlation between the proportion of Poles and percentage of population with ambulatory disability in the United States with a correlation coefficient (R) of 0.570 and weighted average of 6.2%. Similarly, the statistical analysis conducted on geographies consisting of 547,017,856 people shows a very strong positive correlation between the proportion of Immigrants from Europe and percentage of population with ambulatory disability in the United States with a correlation coefficient (R) of 0.817 and weighted average of 6.0%, a difference of 4.1%.
Ambulatory Disability Correlation Summary
| Measurement | Polish | Immigrants from Europe |
| Minimum | 2.2% | 0.74% |
| Maximum | 47.7% | 88.9% |
| Range | 45.5% | 88.1% |
| Mean | 9.1% | 12.3% |
| Median | 6.6% | 6.2% |
| Interquartile 25% (IQ1) | 6.0% | 5.4% |
| Interquartile 75% (IQ3) | 8.8% | 8.2% |
| Interquartile Range (IQR) | 2.8% | 2.8% |
| Standard Deviation (Sample) | 7.4% | 17.4% |
| Standard Deviation (Population) | 7.3% | 17.3% |
Similar Demographics by Ambulatory Disability
Demographics Similar to Poles by Ambulatory Disability
In terms of ambulatory disability, the demographic groups most similar to Poles are Malaysian (6.2%, a difference of 0.12%), Immigrants from Bangladesh (6.2%, a difference of 0.12%), Belgian (6.2%, a difference of 0.15%), Alaska Native (6.2%, a difference of 0.23%), and Guatemalan (6.2%, a difference of 0.24%).
| Demographics | Rating | Rank | Ambulatory Disability |
| Immigrants | Western Africa | 33.4 /100 | #190 | Fair 6.2% |
| Immigrants | Guatemala | 31.9 /100 | #191 | Fair 6.2% |
| Immigrants | Western Europe | 31.6 /100 | #192 | Fair 6.2% |
| Guatemalans | 30.0 /100 | #193 | Fair 6.2% |
| Alaska Natives | 29.8 /100 | #194 | Fair 6.2% |
| Belgians | 28.6 /100 | #195 | Fair 6.2% |
| Malaysians | 28.2 /100 | #196 | Fair 6.2% |
| Poles | 26.3 /100 | #197 | Fair 6.2% |
| Immigrants | Bangladesh | 24.6 /100 | #198 | Fair 6.2% |
| Italians | 22.6 /100 | #199 | Fair 6.2% |
| Immigrants | Cambodia | 21.5 /100 | #200 | Fair 6.2% |
| Immigrants | Central America | 20.1 /100 | #201 | Fair 6.2% |
| Albanians | 19.7 /100 | #202 | Poor 6.2% |
| Immigrants | Ukraine | 18.4 /100 | #203 | Poor 6.2% |
| Immigrants | Congo | 18.2 /100 | #204 | Poor 6.2% |
Demographics Similar to Immigrants from Europe by Ambulatory Disability
In terms of ambulatory disability, the demographic groups most similar to Immigrants from Europe are Immigrants (6.0%, a difference of 0.11%), Ute (6.0%, a difference of 0.15%), Immigrants from Costa Rica (5.9%, a difference of 0.24%), Immigrants from Kazakhstan (5.9%, a difference of 0.27%), and Immigrants from Italy (6.0%, a difference of 0.32%).
| Demographics | Rating | Rank | Ambulatory Disability |
| Koreans | 91.6 /100 | #125 | Exceptional 5.9% |
| Arabs | 91.5 /100 | #126 | Exceptional 5.9% |
| Immigrants | Nigeria | 90.9 /100 | #127 | Exceptional 5.9% |
| Immigrants | Western Asia | 90.7 /100 | #128 | Exceptional 5.9% |
| Immigrants | Norway | 90.5 /100 | #129 | Exceptional 5.9% |
| Immigrants | Kazakhstan | 89.7 /100 | #130 | Excellent 5.9% |
| Immigrants | Costa Rica | 89.5 /100 | #131 | Excellent 5.9% |
| Immigrants | Europe | 87.8 /100 | #132 | Excellent 6.0% |
| Immigrants | Immigrants | 86.9 /100 | #133 | Excellent 6.0% |
| Ute | 86.6 /100 | #134 | Excellent 6.0% |
| Immigrants | Italy | 85.0 /100 | #135 | Excellent 6.0% |
| Immigrants | North Macedonia | 84.1 /100 | #136 | Excellent 6.0% |
| Immigrants | Syria | 84.1 /100 | #137 | Excellent 6.0% |
| Immigrants | Hungary | 83.9 /100 | #138 | Excellent 6.0% |
| Immigrants | Zaire | 83.6 /100 | #139 | Excellent 6.0% |