Japanese vs Immigrants from Chile Ambulatory Disability
COMPARE
Japanese
Immigrants from Chile
Ambulatory Disability
Ambulatory Disability Comparison
Japanese
Immigrants from Chile
6.3%
AMBULATORY DISABILITY
12.0/ 100
METRIC RATING
213th/ 347
METRIC RANK
5.8%
AMBULATORY DISABILITY
98.9/ 100
METRIC RATING
87th/ 347
METRIC RANK
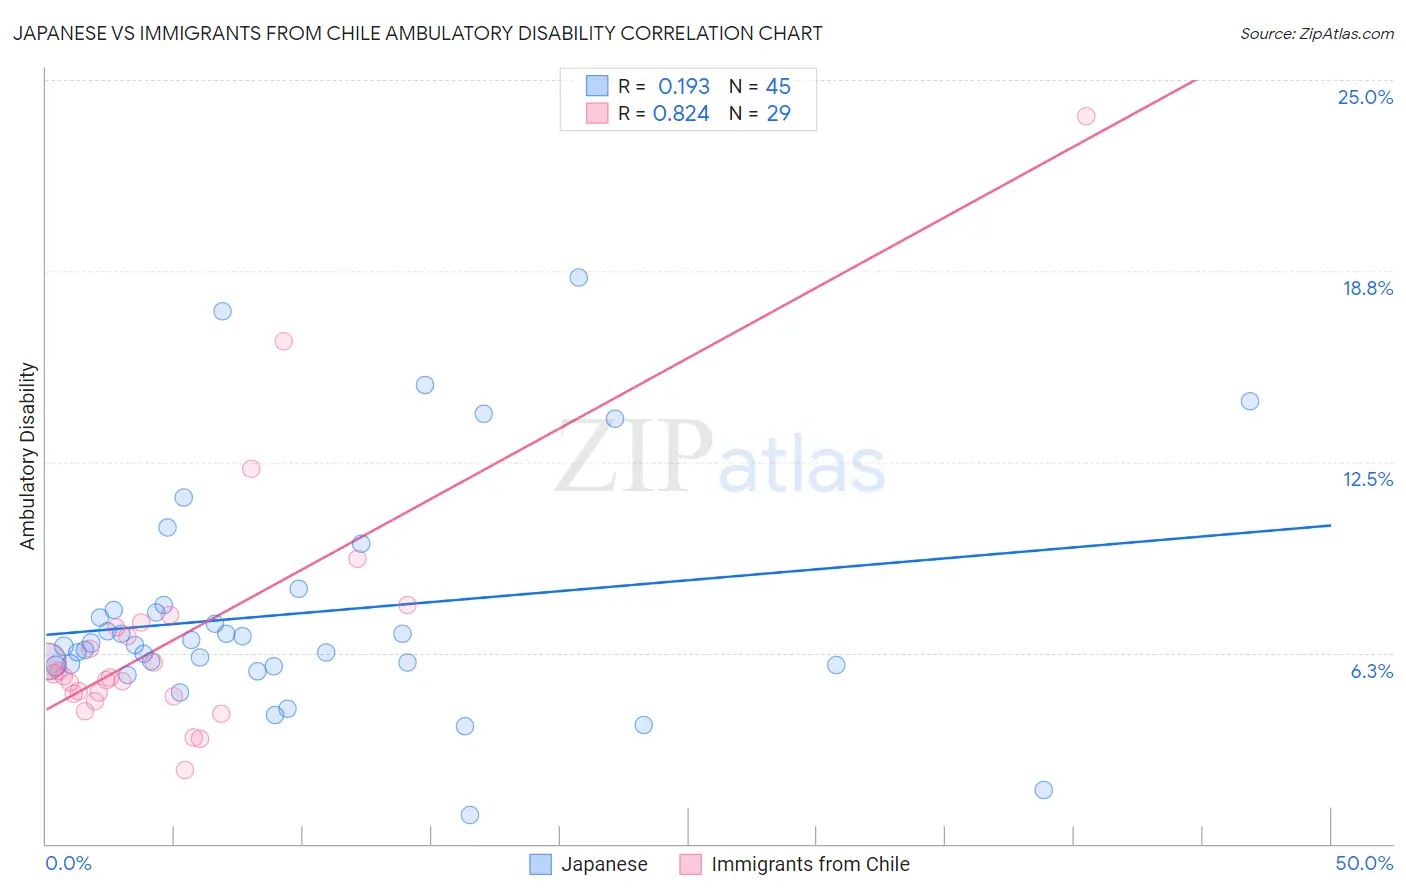
Japanese vs Immigrants from Chile Ambulatory Disability Correlation Chart
The statistical analysis conducted on geographies consisting of 249,121,214 people shows a poor positive correlation between the proportion of Japanese and percentage of population with ambulatory disability in the United States with a correlation coefficient (R) of 0.193 and weighted average of 6.3%. Similarly, the statistical analysis conducted on geographies consisting of 218,629,833 people shows a very strong positive correlation between the proportion of Immigrants from Chile and percentage of population with ambulatory disability in the United States with a correlation coefficient (R) of 0.824 and weighted average of 5.8%, a difference of 9.2%.
Ambulatory Disability Correlation Summary
| Measurement | Japanese | Immigrants from Chile |
| Minimum | 0.93% | 2.4% |
| Maximum | 18.5% | 23.8% |
| Range | 17.6% | 21.4% |
| Mean | 7.5% | 6.8% |
| Median | 6.5% | 5.5% |
| Interquartile 25% (IQ1) | 5.8% | 4.9% |
| Interquartile 75% (IQ3) | 7.7% | 7.2% |
| Interquartile Range (IQR) | 1.9% | 2.3% |
| Standard Deviation (Sample) | 3.7% | 4.3% |
| Standard Deviation (Population) | 3.7% | 4.2% |
Similar Demographics by Ambulatory Disability
Demographics Similar to Japanese by Ambulatory Disability
In terms of ambulatory disability, the demographic groups most similar to Japanese are Mexican American Indian (6.3%, a difference of 0.0%), Samoan (6.3%, a difference of 0.010%), Immigrants from Mexico (6.3%, a difference of 0.12%), Immigrants from Latin America (6.3%, a difference of 0.13%), and Canadian (6.3%, a difference of 0.14%).
| Demographics | Rating | Rank | Ambulatory Disability |
| Finns | 17.2 /100 | #206 | Poor 6.2% |
| Alsatians | 15.1 /100 | #207 | Poor 6.3% |
| Bangladeshis | 14.2 /100 | #208 | Poor 6.3% |
| Immigrants | Iraq | 14.0 /100 | #209 | Poor 6.3% |
| Immigrants | Laos | 13.2 /100 | #210 | Poor 6.3% |
| Samoans | 12.1 /100 | #211 | Poor 6.3% |
| Mexican American Indians | 12.0 /100 | #212 | Poor 6.3% |
| Japanese | 12.0 /100 | #213 | Poor 6.3% |
| Immigrants | Mexico | 11.0 /100 | #214 | Poor 6.3% |
| Immigrants | Latin America | 11.0 /100 | #215 | Poor 6.3% |
| Canadians | 10.9 /100 | #216 | Poor 6.3% |
| Yugoslavians | 10.9 /100 | #217 | Poor 6.3% |
| Guamanians/Chamorros | 10.6 /100 | #218 | Poor 6.3% |
| Indonesians | 9.9 /100 | #219 | Tragic 6.3% |
| Immigrants | Albania | 9.6 /100 | #220 | Tragic 6.3% |
Demographics Similar to Immigrants from Chile by Ambulatory Disability
In terms of ambulatory disability, the demographic groups most similar to Immigrants from Chile are Soviet Union (5.8%, a difference of 0.040%), Latvian (5.7%, a difference of 0.060%), South American (5.7%, a difference of 0.090%), Bhutanese (5.8%, a difference of 0.16%), and Australian (5.8%, a difference of 0.16%).
| Demographics | Rating | Rank | Ambulatory Disability |
| Immigrants | Ireland | 99.2 /100 | #80 | Exceptional 5.7% |
| Immigrants | Jordan | 99.2 /100 | #81 | Exceptional 5.7% |
| Palestinians | 99.2 /100 | #82 | Exceptional 5.7% |
| Eastern Europeans | 99.2 /100 | #83 | Exceptional 5.7% |
| Ugandans | 99.2 /100 | #84 | Exceptional 5.7% |
| South Americans | 99.0 /100 | #85 | Exceptional 5.7% |
| Latvians | 99.0 /100 | #86 | Exceptional 5.7% |
| Immigrants | Chile | 98.9 /100 | #87 | Exceptional 5.8% |
| Soviet Union | 98.9 /100 | #88 | Exceptional 5.8% |
| Bhutanese | 98.8 /100 | #89 | Exceptional 5.8% |
| Australians | 98.8 /100 | #90 | Exceptional 5.8% |
| Immigrants | Sudan | 98.8 /100 | #91 | Exceptional 5.8% |
| Immigrants | Sierra Leone | 98.6 /100 | #92 | Exceptional 5.8% |
| Immigrants | Denmark | 98.6 /100 | #93 | Exceptional 5.8% |
| Kenyans | 98.4 /100 | #94 | Exceptional 5.8% |