Welsh vs Immigrants from Europe Ambulatory Disability
COMPARE
Welsh
Immigrants from Europe
Ambulatory Disability
Ambulatory Disability Comparison
Welsh
Immigrants from Europe
6.5%
AMBULATORY DISABILITY
0.6/ 100
METRIC RATING
255th/ 347
METRIC RANK
6.0%
AMBULATORY DISABILITY
87.8/ 100
METRIC RATING
132nd/ 347
METRIC RANK
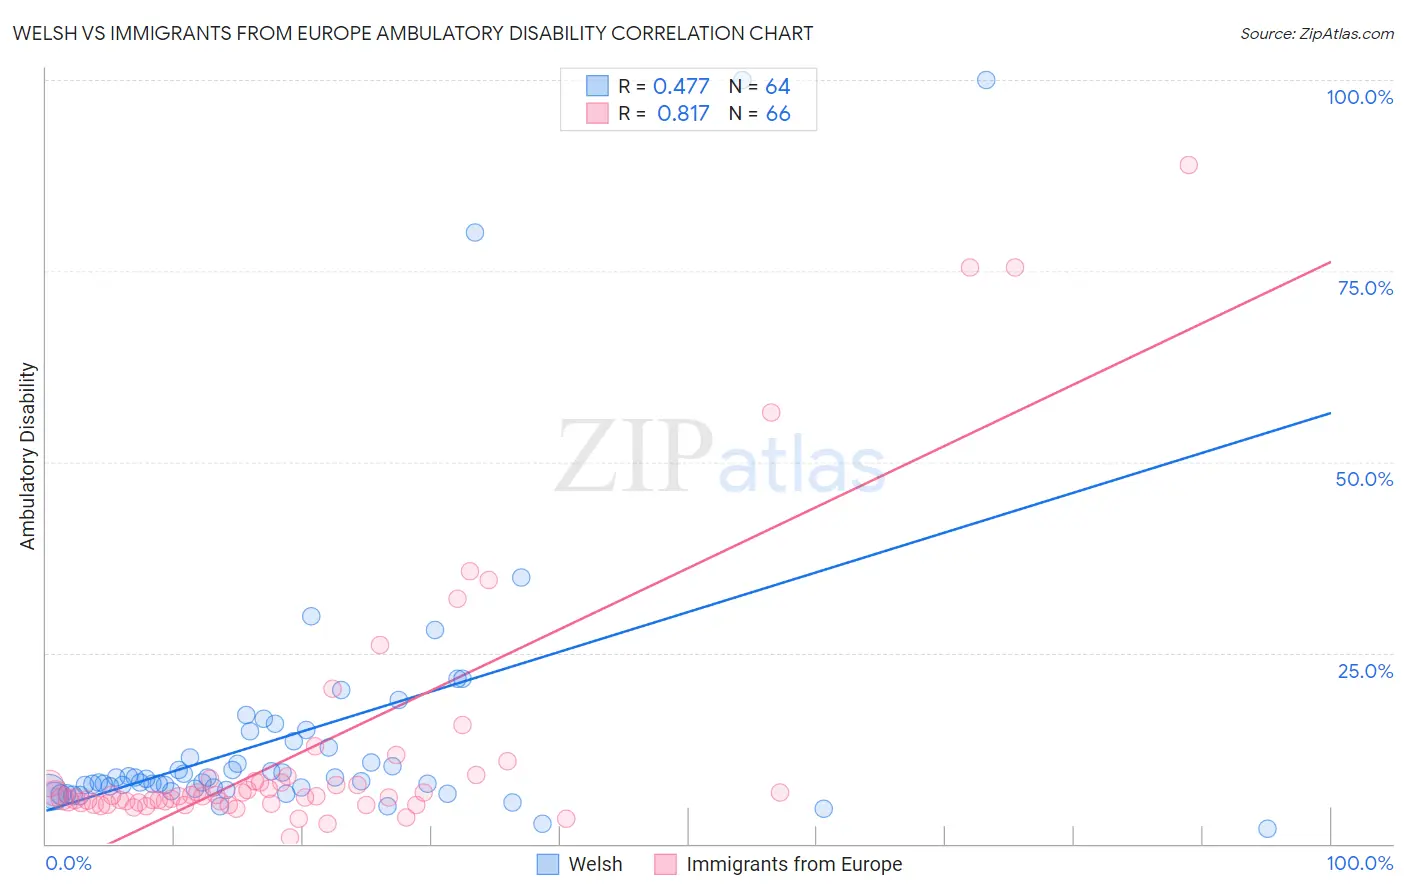
Welsh vs Immigrants from Europe Ambulatory Disability Correlation Chart
The statistical analysis conducted on geographies consisting of 528,297,668 people shows a moderate positive correlation between the proportion of Welsh and percentage of population with ambulatory disability in the United States with a correlation coefficient (R) of 0.477 and weighted average of 6.5%. Similarly, the statistical analysis conducted on geographies consisting of 547,017,856 people shows a very strong positive correlation between the proportion of Immigrants from Europe and percentage of population with ambulatory disability in the United States with a correlation coefficient (R) of 0.817 and weighted average of 6.0%, a difference of 9.6%.
Ambulatory Disability Correlation Summary
| Measurement | Welsh | Immigrants from Europe |
| Minimum | 2.0% | 0.74% |
| Maximum | 100.0% | 88.9% |
| Range | 98.0% | 88.1% |
| Mean | 14.3% | 12.3% |
| Median | 8.3% | 6.2% |
| Interquartile 25% (IQ1) | 7.1% | 5.4% |
| Interquartile 75% (IQ3) | 13.0% | 8.2% |
| Interquartile Range (IQR) | 5.9% | 2.8% |
| Standard Deviation (Sample) | 18.8% | 17.4% |
| Standard Deviation (Population) | 18.7% | 17.3% |
Similar Demographics by Ambulatory Disability
Demographics Similar to Welsh by Ambulatory Disability
In terms of ambulatory disability, the demographic groups most similar to Welsh are Belizean (6.5%, a difference of 0.070%), Immigrants from Uzbekistan (6.5%, a difference of 0.080%), Bermudan (6.5%, a difference of 0.16%), Scottish (6.5%, a difference of 0.23%), and Spanish American Indian (6.5%, a difference of 0.23%).
| Demographics | Rating | Rank | Ambulatory Disability |
| Immigrants | Portugal | 1.4 /100 | #248 | Tragic 6.5% |
| Native Hawaiians | 1.1 /100 | #249 | Tragic 6.5% |
| Chinese | 1.0 /100 | #250 | Tragic 6.5% |
| Hawaiians | 0.9 /100 | #251 | Tragic 6.5% |
| Immigrants | Bahamas | 0.8 /100 | #252 | Tragic 6.5% |
| Scottish | 0.7 /100 | #253 | Tragic 6.5% |
| Belizeans | 0.7 /100 | #254 | Tragic 6.5% |
| Welsh | 0.6 /100 | #255 | Tragic 6.5% |
| Immigrants | Uzbekistan | 0.6 /100 | #256 | Tragic 6.5% |
| Bermudans | 0.5 /100 | #257 | Tragic 6.5% |
| Spanish American Indians | 0.5 /100 | #258 | Tragic 6.5% |
| Aleuts | 0.4 /100 | #259 | Tragic 6.6% |
| Immigrants | Belize | 0.4 /100 | #260 | Tragic 6.6% |
| Irish | 0.4 /100 | #261 | Tragic 6.6% |
| English | 0.4 /100 | #262 | Tragic 6.6% |
Demographics Similar to Immigrants from Europe by Ambulatory Disability
In terms of ambulatory disability, the demographic groups most similar to Immigrants from Europe are Immigrants (6.0%, a difference of 0.11%), Ute (6.0%, a difference of 0.15%), Immigrants from Costa Rica (5.9%, a difference of 0.24%), Immigrants from Kazakhstan (5.9%, a difference of 0.27%), and Immigrants from Italy (6.0%, a difference of 0.32%).
| Demographics | Rating | Rank | Ambulatory Disability |
| Koreans | 91.6 /100 | #125 | Exceptional 5.9% |
| Arabs | 91.5 /100 | #126 | Exceptional 5.9% |
| Immigrants | Nigeria | 90.9 /100 | #127 | Exceptional 5.9% |
| Immigrants | Western Asia | 90.7 /100 | #128 | Exceptional 5.9% |
| Immigrants | Norway | 90.5 /100 | #129 | Exceptional 5.9% |
| Immigrants | Kazakhstan | 89.7 /100 | #130 | Excellent 5.9% |
| Immigrants | Costa Rica | 89.5 /100 | #131 | Excellent 5.9% |
| Immigrants | Europe | 87.8 /100 | #132 | Excellent 6.0% |
| Immigrants | Immigrants | 86.9 /100 | #133 | Excellent 6.0% |
| Ute | 86.6 /100 | #134 | Excellent 6.0% |
| Immigrants | Italy | 85.0 /100 | #135 | Excellent 6.0% |
| Immigrants | North Macedonia | 84.1 /100 | #136 | Excellent 6.0% |
| Immigrants | Syria | 84.1 /100 | #137 | Excellent 6.0% |
| Immigrants | Hungary | 83.9 /100 | #138 | Excellent 6.0% |
| Immigrants | Zaire | 83.6 /100 | #139 | Excellent 6.0% |