Japanese vs Immigrants from Netherlands Ambulatory Disability
COMPARE
Japanese
Immigrants from Netherlands
Ambulatory Disability
Ambulatory Disability Comparison
Japanese
Immigrants from Netherlands
6.3%
AMBULATORY DISABILITY
12.0/ 100
METRIC RATING
213th/ 347
METRIC RANK
5.8%
AMBULATORY DISABILITY
97.1/ 100
METRIC RATING
109th/ 347
METRIC RANK
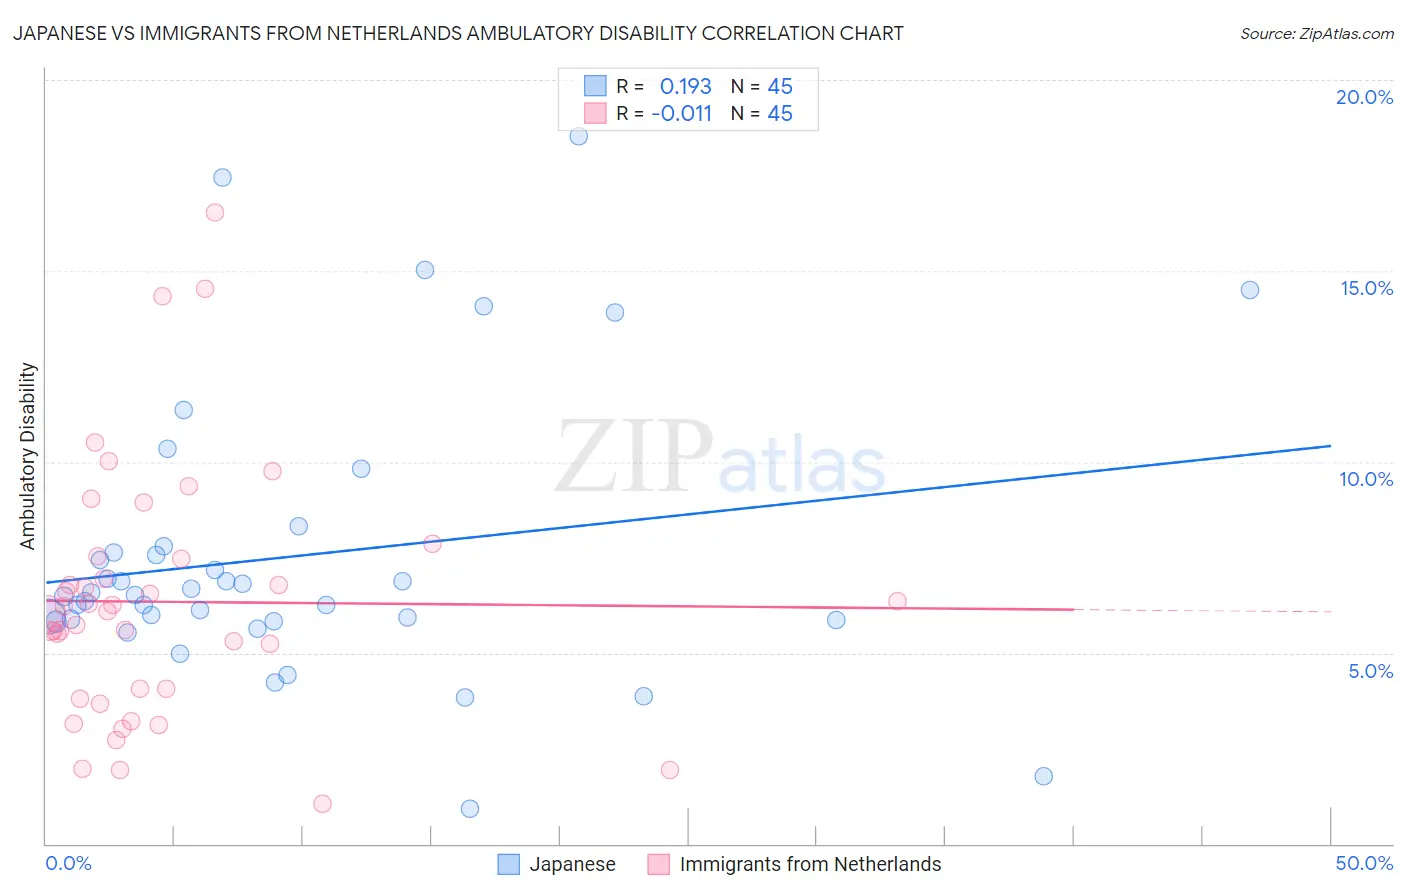
Japanese vs Immigrants from Netherlands Ambulatory Disability Correlation Chart
The statistical analysis conducted on geographies consisting of 249,121,214 people shows a poor positive correlation between the proportion of Japanese and percentage of population with ambulatory disability in the United States with a correlation coefficient (R) of 0.193 and weighted average of 6.3%. Similarly, the statistical analysis conducted on geographies consisting of 237,838,654 people shows no correlation between the proportion of Immigrants from Netherlands and percentage of population with ambulatory disability in the United States with a correlation coefficient (R) of -0.011 and weighted average of 5.8%, a difference of 7.7%.
Ambulatory Disability Correlation Summary
| Measurement | Japanese | Immigrants from Netherlands |
| Minimum | 0.93% | 1.1% |
| Maximum | 18.5% | 16.5% |
| Range | 17.6% | 15.5% |
| Mean | 7.5% | 6.3% |
| Median | 6.5% | 6.1% |
| Interquartile 25% (IQ1) | 5.8% | 3.9% |
| Interquartile 75% (IQ3) | 7.7% | 7.5% |
| Interquartile Range (IQR) | 1.9% | 3.6% |
| Standard Deviation (Sample) | 3.7% | 3.3% |
| Standard Deviation (Population) | 3.7% | 3.3% |
Similar Demographics by Ambulatory Disability
Demographics Similar to Japanese by Ambulatory Disability
In terms of ambulatory disability, the demographic groups most similar to Japanese are Mexican American Indian (6.3%, a difference of 0.0%), Samoan (6.3%, a difference of 0.010%), Immigrants from Mexico (6.3%, a difference of 0.12%), Immigrants from Latin America (6.3%, a difference of 0.13%), and Canadian (6.3%, a difference of 0.14%).
| Demographics | Rating | Rank | Ambulatory Disability |
| Finns | 17.2 /100 | #206 | Poor 6.2% |
| Alsatians | 15.1 /100 | #207 | Poor 6.3% |
| Bangladeshis | 14.2 /100 | #208 | Poor 6.3% |
| Immigrants | Iraq | 14.0 /100 | #209 | Poor 6.3% |
| Immigrants | Laos | 13.2 /100 | #210 | Poor 6.3% |
| Samoans | 12.1 /100 | #211 | Poor 6.3% |
| Mexican American Indians | 12.0 /100 | #212 | Poor 6.3% |
| Japanese | 12.0 /100 | #213 | Poor 6.3% |
| Immigrants | Mexico | 11.0 /100 | #214 | Poor 6.3% |
| Immigrants | Latin America | 11.0 /100 | #215 | Poor 6.3% |
| Canadians | 10.9 /100 | #216 | Poor 6.3% |
| Yugoslavians | 10.9 /100 | #217 | Poor 6.3% |
| Guamanians/Chamorros | 10.6 /100 | #218 | Poor 6.3% |
| Indonesians | 9.9 /100 | #219 | Tragic 6.3% |
| Immigrants | Albania | 9.6 /100 | #220 | Tragic 6.3% |
Demographics Similar to Immigrants from Netherlands by Ambulatory Disability
In terms of ambulatory disability, the demographic groups most similar to Immigrants from Netherlands are Colombian (5.8%, a difference of 0.020%), Uruguayan (5.8%, a difference of 0.030%), Immigrants from Morocco (5.8%, a difference of 0.080%), Immigrants from Czechoslovakia (5.8%, a difference of 0.15%), and Immigrants from Colombia (5.8%, a difference of 0.18%).
| Demographics | Rating | Rank | Ambulatory Disability |
| Immigrants | Kenya | 97.8 /100 | #102 | Exceptional 5.8% |
| Immigrants | Romania | 97.7 /100 | #103 | Exceptional 5.8% |
| New Zealanders | 97.6 /100 | #104 | Exceptional 5.8% |
| Immigrants | Czechoslovakia | 97.4 /100 | #105 | Exceptional 5.8% |
| Immigrants | Morocco | 97.3 /100 | #106 | Exceptional 5.8% |
| Uruguayans | 97.2 /100 | #107 | Exceptional 5.8% |
| Colombians | 97.2 /100 | #108 | Exceptional 5.8% |
| Immigrants | Netherlands | 97.1 /100 | #109 | Exceptional 5.8% |
| Immigrants | Colombia | 96.7 /100 | #110 | Exceptional 5.8% |
| Danes | 96.6 /100 | #111 | Exceptional 5.8% |
| South Africans | 96.3 /100 | #112 | Exceptional 5.9% |
| Immigrants | Uruguay | 95.6 /100 | #113 | Exceptional 5.9% |
| Immigrants | Poland | 95.4 /100 | #114 | Exceptional 5.9% |
| South American Indians | 94.8 /100 | #115 | Exceptional 5.9% |
| Immigrants | Africa | 94.7 /100 | #116 | Exceptional 5.9% |