Japanese vs Immigrants from Europe Nursery School
COMPARE
Japanese
Immigrants from Europe
Nursery School
Nursery School Comparison
Japanese
Immigrants from Europe
96.7%
NURSERY SCHOOL
0.0/ 100
METRIC RATING
330th/ 347
METRIC RANK
98.1%
NURSERY SCHOOL
90.7/ 100
METRIC RATING
133rd/ 347
METRIC RANK
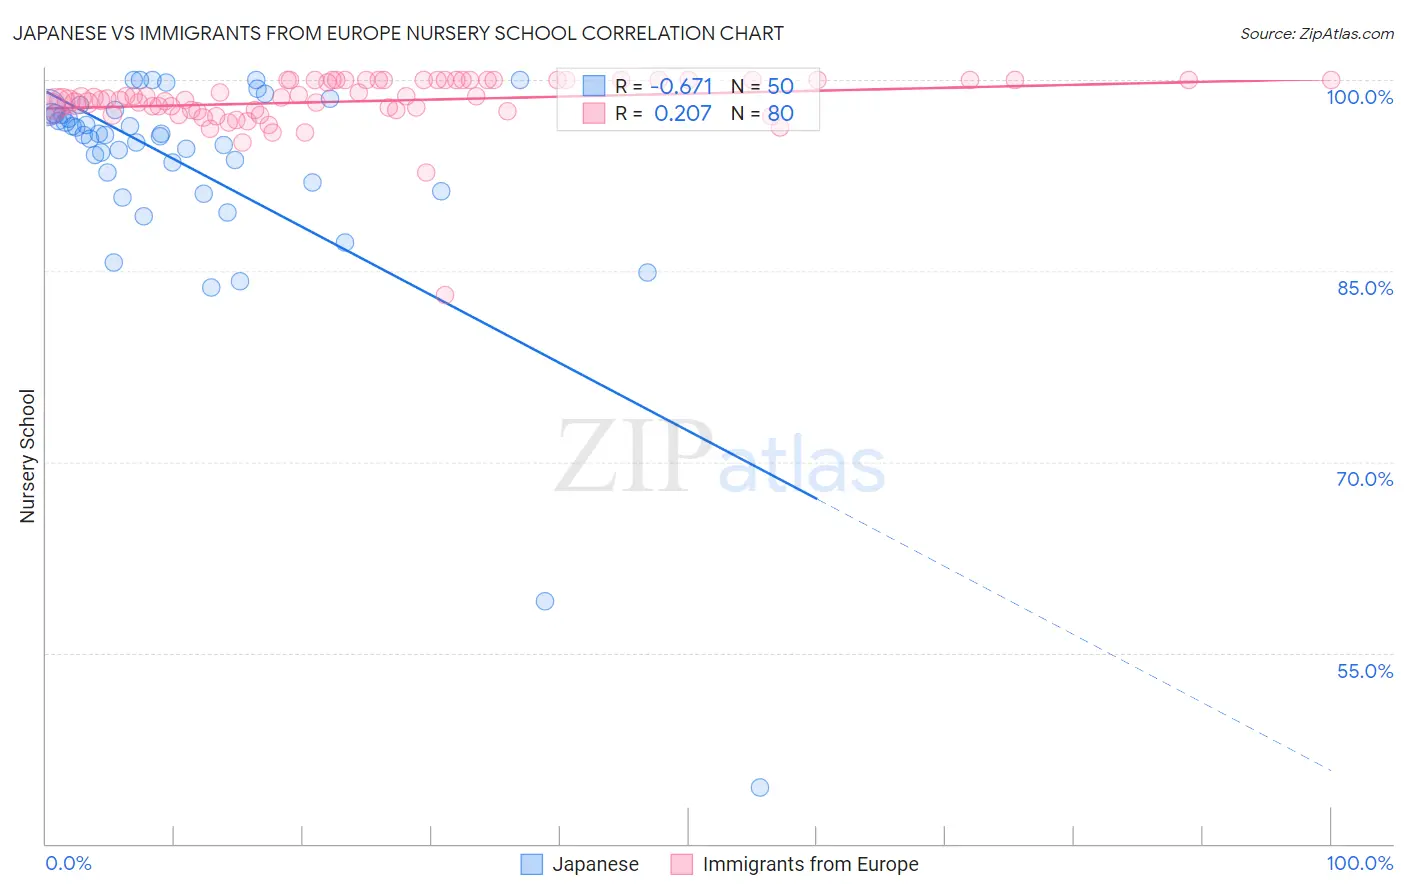
Japanese vs Immigrants from Europe Nursery School Correlation Chart
The statistical analysis conducted on geographies consisting of 249,183,224 people shows a significant negative correlation between the proportion of Japanese and percentage of population with at least nursery school education in the United States with a correlation coefficient (R) of -0.671 and weighted average of 96.7%. Similarly, the statistical analysis conducted on geographies consisting of 547,425,973 people shows a weak positive correlation between the proportion of Immigrants from Europe and percentage of population with at least nursery school education in the United States with a correlation coefficient (R) of 0.207 and weighted average of 98.1%, a difference of 1.5%.
Nursery School Correlation Summary
| Measurement | Japanese | Immigrants from Europe |
| Minimum | 44.4% | 83.1% |
| Maximum | 100.0% | 100.0% |
| Range | 55.6% | 16.9% |
| Mean | 93.0% | 98.3% |
| Median | 95.6% | 98.5% |
| Interquartile 25% (IQ1) | 92.0% | 97.6% |
| Interquartile 75% (IQ3) | 97.4% | 100.0% |
| Interquartile Range (IQR) | 5.4% | 2.4% |
| Standard Deviation (Sample) | 9.6% | 2.2% |
| Standard Deviation (Population) | 9.5% | 2.2% |
Similar Demographics by Nursery School
Demographics Similar to Japanese by Nursery School
In terms of nursery school, the demographic groups most similar to Japanese are Immigrants from Vietnam (96.7%, a difference of 0.010%), Immigrants from Armenia (96.7%, a difference of 0.020%), Yakama (96.6%, a difference of 0.040%), Immigrants from Latin America (96.7%, a difference of 0.060%), and Central American (96.6%, a difference of 0.060%).
| Demographics | Rating | Rank | Nursery School |
| Immigrants | Honduras | 0.0 /100 | #323 | Tragic 96.9% |
| Vietnamese | 0.0 /100 | #324 | Tragic 96.8% |
| Dominicans | 0.0 /100 | #325 | Tragic 96.8% |
| Indonesians | 0.0 /100 | #326 | Tragic 96.8% |
| Mexicans | 0.0 /100 | #327 | Tragic 96.8% |
| Immigrants | Latin America | 0.0 /100 | #328 | Tragic 96.7% |
| Immigrants | Vietnam | 0.0 /100 | #329 | Tragic 96.7% |
| Japanese | 0.0 /100 | #330 | Tragic 96.7% |
| Immigrants | Armenia | 0.0 /100 | #331 | Tragic 96.7% |
| Yakama | 0.0 /100 | #332 | Tragic 96.6% |
| Central Americans | 0.0 /100 | #333 | Tragic 96.6% |
| Immigrants | Dominican Republic | 0.0 /100 | #334 | Tragic 96.6% |
| Bangladeshis | 0.0 /100 | #335 | Tragic 96.6% |
| Guatemalans | 0.0 /100 | #336 | Tragic 96.6% |
| Immigrants | Cambodia | 0.0 /100 | #337 | Tragic 96.5% |
Demographics Similar to Immigrants from Europe by Nursery School
In terms of nursery school, the demographic groups most similar to Immigrants from Europe are Spaniard (98.2%, a difference of 0.0%), Seminole (98.2%, a difference of 0.0%), Cambodian (98.2%, a difference of 0.010%), Immigrants from Croatia (98.2%, a difference of 0.010%), and Immigrants from Bulgaria (98.1%, a difference of 0.010%).
| Demographics | Rating | Rank | Nursery School |
| Menominee | 93.6 /100 | #126 | Exceptional 98.2% |
| Immigrants | Saudi Arabia | 93.4 /100 | #127 | Exceptional 98.2% |
| Immigrants | Serbia | 92.4 /100 | #128 | Exceptional 98.2% |
| Cambodians | 91.4 /100 | #129 | Exceptional 98.2% |
| Immigrants | Croatia | 91.4 /100 | #130 | Exceptional 98.2% |
| Spaniards | 91.1 /100 | #131 | Exceptional 98.2% |
| Seminole | 90.9 /100 | #132 | Exceptional 98.2% |
| Immigrants | Europe | 90.7 /100 | #133 | Exceptional 98.1% |
| Immigrants | Bulgaria | 89.4 /100 | #134 | Excellent 98.1% |
| Immigrants | Hungary | 89.3 /100 | #135 | Excellent 98.1% |
| Immigrants | Kuwait | 88.9 /100 | #136 | Excellent 98.1% |
| Israelis | 88.2 /100 | #137 | Excellent 98.1% |
| Immigrants | Romania | 88.0 /100 | #138 | Excellent 98.1% |
| Blackfeet | 87.5 /100 | #139 | Excellent 98.1% |
| Palestinians | 83.7 /100 | #140 | Excellent 98.1% |