Japanese vs Immigrants from Spain Ambulatory Disability
COMPARE
Japanese
Immigrants from Spain
Ambulatory Disability
Ambulatory Disability Comparison
Japanese
Immigrants from Spain
6.3%
AMBULATORY DISABILITY
12.0/ 100
METRIC RATING
213th/ 347
METRIC RANK
5.6%
AMBULATORY DISABILITY
99.7/ 100
METRIC RATING
62nd/ 347
METRIC RANK
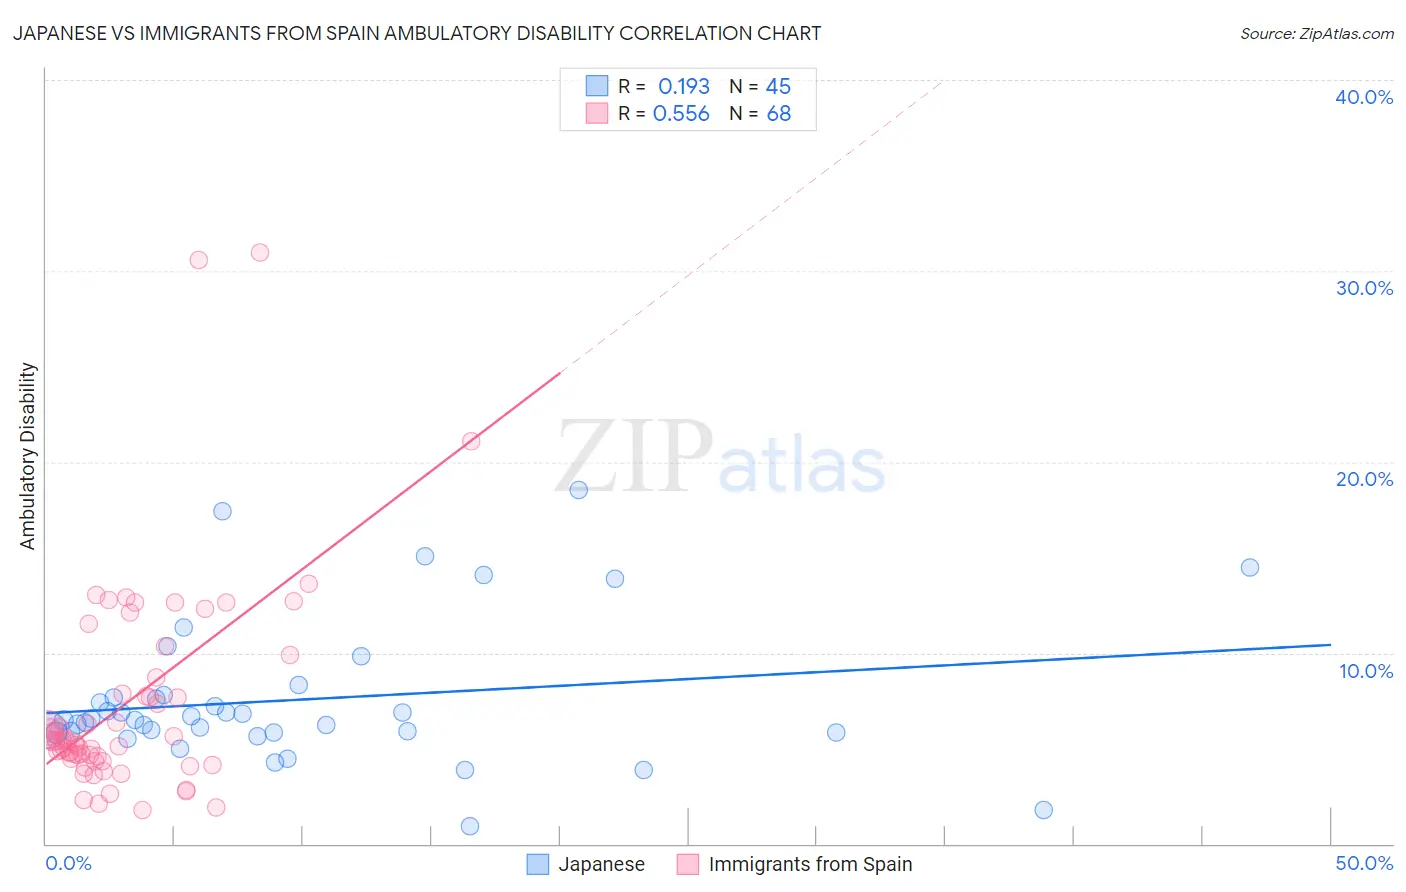
Japanese vs Immigrants from Spain Ambulatory Disability Correlation Chart
The statistical analysis conducted on geographies consisting of 249,121,214 people shows a poor positive correlation between the proportion of Japanese and percentage of population with ambulatory disability in the United States with a correlation coefficient (R) of 0.193 and weighted average of 6.3%. Similarly, the statistical analysis conducted on geographies consisting of 239,653,426 people shows a substantial positive correlation between the proportion of Immigrants from Spain and percentage of population with ambulatory disability in the United States with a correlation coefficient (R) of 0.556 and weighted average of 5.6%, a difference of 11.4%.
Ambulatory Disability Correlation Summary
| Measurement | Japanese | Immigrants from Spain |
| Minimum | 0.93% | 1.8% |
| Maximum | 18.5% | 31.0% |
| Range | 17.6% | 29.2% |
| Mean | 7.5% | 7.3% |
| Median | 6.5% | 5.4% |
| Interquartile 25% (IQ1) | 5.8% | 4.5% |
| Interquartile 75% (IQ3) | 7.7% | 8.3% |
| Interquartile Range (IQR) | 1.9% | 3.8% |
| Standard Deviation (Sample) | 3.7% | 5.5% |
| Standard Deviation (Population) | 3.7% | 5.5% |
Similar Demographics by Ambulatory Disability
Demographics Similar to Japanese by Ambulatory Disability
In terms of ambulatory disability, the demographic groups most similar to Japanese are Mexican American Indian (6.3%, a difference of 0.0%), Samoan (6.3%, a difference of 0.010%), Immigrants from Mexico (6.3%, a difference of 0.12%), Immigrants from Latin America (6.3%, a difference of 0.13%), and Canadian (6.3%, a difference of 0.14%).
| Demographics | Rating | Rank | Ambulatory Disability |
| Finns | 17.2 /100 | #206 | Poor 6.2% |
| Alsatians | 15.1 /100 | #207 | Poor 6.3% |
| Bangladeshis | 14.2 /100 | #208 | Poor 6.3% |
| Immigrants | Iraq | 14.0 /100 | #209 | Poor 6.3% |
| Immigrants | Laos | 13.2 /100 | #210 | Poor 6.3% |
| Samoans | 12.1 /100 | #211 | Poor 6.3% |
| Mexican American Indians | 12.0 /100 | #212 | Poor 6.3% |
| Japanese | 12.0 /100 | #213 | Poor 6.3% |
| Immigrants | Mexico | 11.0 /100 | #214 | Poor 6.3% |
| Immigrants | Latin America | 11.0 /100 | #215 | Poor 6.3% |
| Canadians | 10.9 /100 | #216 | Poor 6.3% |
| Yugoslavians | 10.9 /100 | #217 | Poor 6.3% |
| Guamanians/Chamorros | 10.6 /100 | #218 | Poor 6.3% |
| Indonesians | 9.9 /100 | #219 | Tragic 6.3% |
| Immigrants | Albania | 9.6 /100 | #220 | Tragic 6.3% |
Demographics Similar to Immigrants from Spain by Ambulatory Disability
In terms of ambulatory disability, the demographic groups most similar to Immigrants from Spain are Immigrants from Belgium (5.6%, a difference of 0.010%), Immigrants from France (5.6%, a difference of 0.12%), Immigrants from Lithuania (5.6%, a difference of 0.13%), Immigrants from Afghanistan (5.6%, a difference of 0.17%), and Immigrants from Zimbabwe (5.6%, a difference of 0.21%).
| Demographics | Rating | Rank | Ambulatory Disability |
| Immigrants | Bulgaria | 99.8 /100 | #55 | Exceptional 5.6% |
| Inupiat | 99.8 /100 | #56 | Exceptional 5.6% |
| Immigrants | Brazil | 99.8 /100 | #57 | Exceptional 5.6% |
| Immigrants | Zimbabwe | 99.8 /100 | #58 | Exceptional 5.6% |
| Immigrants | Afghanistan | 99.8 /100 | #59 | Exceptional 5.6% |
| Immigrants | Lithuania | 99.8 /100 | #60 | Exceptional 5.6% |
| Immigrants | Belgium | 99.7 /100 | #61 | Exceptional 5.6% |
| Immigrants | Spain | 99.7 /100 | #62 | Exceptional 5.6% |
| Immigrants | France | 99.7 /100 | #63 | Exceptional 5.6% |
| Laotians | 99.7 /100 | #64 | Exceptional 5.7% |
| Immigrants | Switzerland | 99.7 /100 | #65 | Exceptional 5.7% |
| Israelis | 99.6 /100 | #66 | Exceptional 5.7% |
| Immigrants | Uganda | 99.6 /100 | #67 | Exceptional 5.7% |
| Sri Lankans | 99.6 /100 | #68 | Exceptional 5.7% |
| Peruvians | 99.5 /100 | #69 | Exceptional 5.7% |