Hispanic or Latino vs Immigrants from Cuba Disability Age 5 to 17
COMPARE
Hispanic or Latino
Immigrants from Cuba
Disability Age 5 to 17
Disability Age 5 to 17 Comparison
Hispanics or Latinos
Immigrants from Cuba
5.9%
DISABILITY AGE 5 TO 17
1.0/ 100
METRIC RATING
257th/ 347
METRIC RANK
5.2%
DISABILITY AGE 5 TO 17
99.6/ 100
METRIC RATING
78th/ 347
METRIC RANK
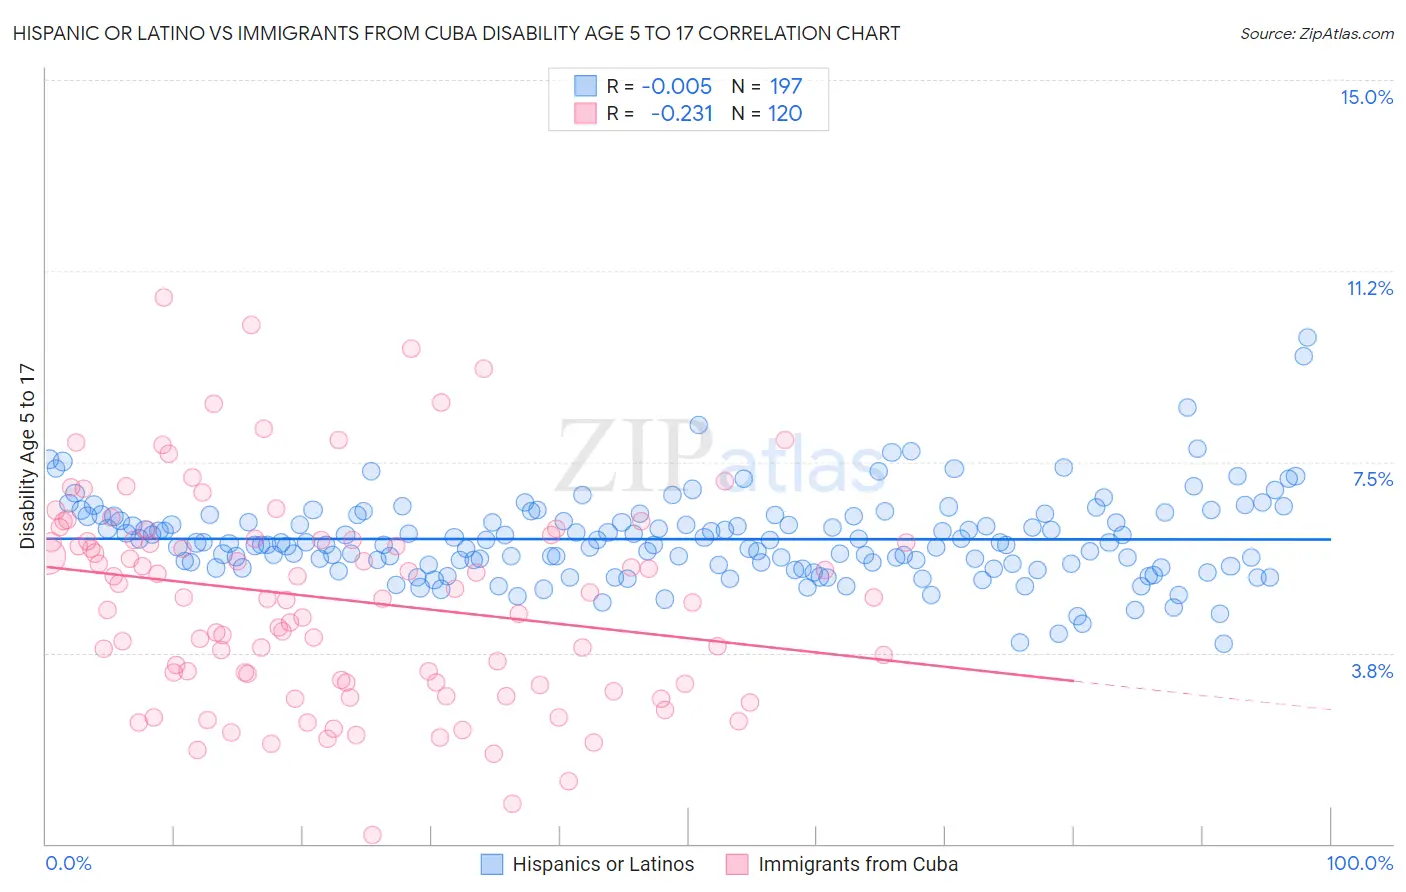
Hispanic or Latino vs Immigrants from Cuba Disability Age 5 to 17 Correlation Chart
The statistical analysis conducted on geographies consisting of 559,956,499 people shows no correlation between the proportion of Hispanics or Latinos and percentage of population with a disability between the ages 5 and 17 in the United States with a correlation coefficient (R) of -0.005 and weighted average of 5.9%. Similarly, the statistical analysis conducted on geographies consisting of 323,753,754 people shows a weak negative correlation between the proportion of Immigrants from Cuba and percentage of population with a disability between the ages 5 and 17 in the United States with a correlation coefficient (R) of -0.231 and weighted average of 5.2%, a difference of 13.4%.
Disability Age 5 to 17 Correlation Summary
| Measurement | Hispanic or Latino | Immigrants from Cuba |
| Minimum | 3.9% | 0.17% |
| Maximum | 9.9% | 10.7% |
| Range | 6.0% | 10.6% |
| Mean | 6.0% | 4.8% |
| Median | 5.9% | 4.8% |
| Interquartile 25% (IQ1) | 5.5% | 3.2% |
| Interquartile 75% (IQ3) | 6.4% | 6.0% |
| Interquartile Range (IQR) | 0.96% | 2.8% |
| Standard Deviation (Sample) | 0.85% | 2.0% |
| Standard Deviation (Population) | 0.84% | 2.0% |
Similar Demographics by Disability Age 5 to 17
Demographics Similar to Hispanics or Latinos by Disability Age 5 to 17
In terms of disability age 5 to 17, the demographic groups most similar to Hispanics or Latinos are Brazilian (5.9%, a difference of 0.040%), Hopi (5.9%, a difference of 0.090%), Slavic (5.9%, a difference of 0.090%), Somali (5.9%, a difference of 0.22%), and Italian (5.9%, a difference of 0.28%).
| Demographics | Rating | Rank | Disability Age 5 to 17 |
| Poles | 1.5 /100 | #250 | Tragic 5.9% |
| Immigrants | Cambodia | 1.5 /100 | #251 | Tragic 5.9% |
| Hondurans | 1.5 /100 | #252 | Tragic 5.9% |
| Scandinavians | 1.4 /100 | #253 | Tragic 5.9% |
| Barbadians | 1.3 /100 | #254 | Tragic 5.9% |
| Italians | 1.2 /100 | #255 | Tragic 5.9% |
| Hopi | 1.0 /100 | #256 | Tragic 5.9% |
| Hispanics or Latinos | 1.0 /100 | #257 | Tragic 5.9% |
| Brazilians | 0.9 /100 | #258 | Tragic 5.9% |
| Slavs | 0.9 /100 | #259 | Tragic 5.9% |
| Somalis | 0.8 /100 | #260 | Tragic 5.9% |
| Immigrants | Middle Africa | 0.7 /100 | #261 | Tragic 5.9% |
| Immigrants | Western Africa | 0.7 /100 | #262 | Tragic 5.9% |
| Czechoslovakians | 0.7 /100 | #263 | Tragic 5.9% |
| Canadians | 0.6 /100 | #264 | Tragic 6.0% |
Demographics Similar to Immigrants from Cuba by Disability Age 5 to 17
In terms of disability age 5 to 17, the demographic groups most similar to Immigrants from Cuba are Immigrants from Kazakhstan (5.2%, a difference of 0.010%), Immigrants from Guyana (5.2%, a difference of 0.040%), Afghan (5.2%, a difference of 0.040%), Sri Lankan (5.2%, a difference of 0.060%), and Immigrants from Moldova (5.2%, a difference of 0.070%).
| Demographics | Rating | Rank | Disability Age 5 to 17 |
| Jordanians | 99.7 /100 | #71 | Exceptional 5.2% |
| Immigrants | Vietnam | 99.7 /100 | #72 | Exceptional 5.2% |
| Immigrants | Czechoslovakia | 99.7 /100 | #73 | Exceptional 5.2% |
| Immigrants | Romania | 99.7 /100 | #74 | Exceptional 5.2% |
| Immigrants | Moldova | 99.6 /100 | #75 | Exceptional 5.2% |
| Immigrants | Guyana | 99.6 /100 | #76 | Exceptional 5.2% |
| Immigrants | Kazakhstan | 99.6 /100 | #77 | Exceptional 5.2% |
| Immigrants | Cuba | 99.6 /100 | #78 | Exceptional 5.2% |
| Afghans | 99.6 /100 | #79 | Exceptional 5.2% |
| Sri Lankans | 99.6 /100 | #80 | Exceptional 5.2% |
| Native Hawaiians | 99.6 /100 | #81 | Exceptional 5.2% |
| Immigrants | Sweden | 99.5 /100 | #82 | Exceptional 5.2% |
| Immigrants | France | 99.5 /100 | #83 | Exceptional 5.2% |
| Immigrants | Nicaragua | 99.5 /100 | #84 | Exceptional 5.2% |
| Bulgarians | 99.4 /100 | #85 | Exceptional 5.2% |