Hispanic or Latino vs Immigrants from Cuba Unemployment
COMPARE
Hispanic or Latino
Immigrants from Cuba
Unemployment
Unemployment Comparison
Hispanics or Latinos
Immigrants from Cuba
5.9%
UNEMPLOYMENT
0.0/ 100
METRIC RATING
272nd/ 347
METRIC RANK
4.6%
UNEMPLOYMENT
100.0/ 100
METRIC RATING
14th/ 347
METRIC RANK
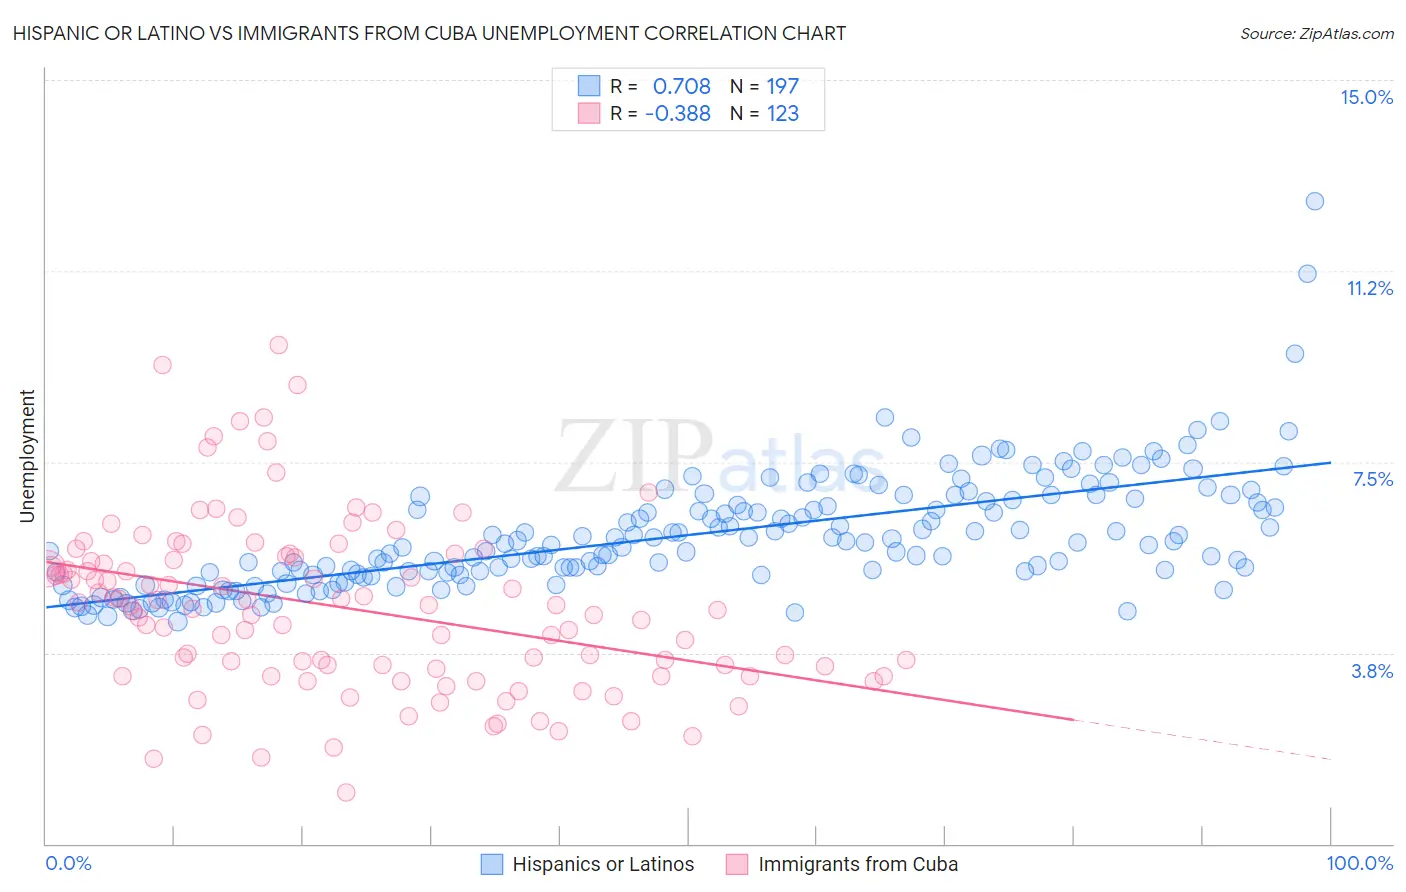
Hispanic or Latino vs Immigrants from Cuba Unemployment Correlation Chart
The statistical analysis conducted on geographies consisting of 570,210,949 people shows a strong positive correlation between the proportion of Hispanics or Latinos and unemployment in the United States with a correlation coefficient (R) of 0.708 and weighted average of 5.9%. Similarly, the statistical analysis conducted on geographies consisting of 325,813,877 people shows a mild negative correlation between the proportion of Immigrants from Cuba and unemployment in the United States with a correlation coefficient (R) of -0.388 and weighted average of 4.6%, a difference of 27.6%.
Unemployment Correlation Summary
| Measurement | Hispanic or Latino | Immigrants from Cuba |
| Minimum | 4.4% | 1.0% |
| Maximum | 12.6% | 9.8% |
| Range | 8.3% | 8.8% |
| Mean | 6.0% | 4.6% |
| Median | 5.9% | 4.7% |
| Interquartile 25% (IQ1) | 5.3% | 3.4% |
| Interquartile 75% (IQ3) | 6.7% | 5.6% |
| Interquartile Range (IQR) | 1.4% | 2.2% |
| Standard Deviation (Sample) | 1.1% | 1.7% |
| Standard Deviation (Population) | 1.1% | 1.7% |
Similar Demographics by Unemployment
Demographics Similar to Hispanics or Latinos by Unemployment
In terms of unemployment, the demographic groups most similar to Hispanics or Latinos are Immigrants from Fiji (5.9%, a difference of 0.17%), Bahamian (5.9%, a difference of 0.46%), Immigrants from Latin America (5.9%, a difference of 0.67%), Mexican (5.9%, a difference of 0.68%), and Blackfeet (5.8%, a difference of 0.92%).
| Demographics | Rating | Rank | Unemployment |
| Nigerians | 0.1 /100 | #265 | Tragic 5.8% |
| Mexican American Indians | 0.1 /100 | #266 | Tragic 5.8% |
| Immigrants | Nigeria | 0.1 /100 | #267 | Tragic 5.8% |
| Immigrants | Sierra Leone | 0.1 /100 | #268 | Tragic 5.8% |
| Immigrants | El Salvador | 0.1 /100 | #269 | Tragic 5.8% |
| Blackfeet | 0.1 /100 | #270 | Tragic 5.8% |
| Mexicans | 0.1 /100 | #271 | Tragic 5.9% |
| Hispanics or Latinos | 0.0 /100 | #272 | Tragic 5.9% |
| Immigrants | Fiji | 0.0 /100 | #273 | Tragic 5.9% |
| Bahamians | 0.0 /100 | #274 | Tragic 5.9% |
| Immigrants | Latin America | 0.0 /100 | #275 | Tragic 5.9% |
| Immigrants | Central America | 0.0 /100 | #276 | Tragic 6.0% |
| Armenians | 0.0 /100 | #277 | Tragic 6.0% |
| Ghanaians | 0.0 /100 | #278 | Tragic 6.0% |
| Immigrants | Mexico | 0.0 /100 | #279 | Tragic 6.0% |
Demographics Similar to Immigrants from Cuba by Unemployment
In terms of unemployment, the demographic groups most similar to Immigrants from Cuba are Belgian (4.6%, a difference of 0.24%), Pennsylvania German (4.6%, a difference of 0.40%), European (4.6%, a difference of 0.48%), English (4.6%, a difference of 0.50%), and Chinese (4.7%, a difference of 0.62%).
| Demographics | Rating | Rank | Unemployment |
| Immigrants | India | 100.0 /100 | #7 | Exceptional 4.5% |
| Swiss | 100.0 /100 | #8 | Exceptional 4.5% |
| Scandinavians | 100.0 /100 | #9 | Exceptional 4.5% |
| Dutch | 100.0 /100 | #10 | Exceptional 4.6% |
| English | 100.0 /100 | #11 | Exceptional 4.6% |
| Pennsylvania Germans | 100.0 /100 | #12 | Exceptional 4.6% |
| Belgians | 100.0 /100 | #13 | Exceptional 4.6% |
| Immigrants | Cuba | 100.0 /100 | #14 | Exceptional 4.6% |
| Europeans | 99.9 /100 | #15 | Exceptional 4.6% |
| Chinese | 99.9 /100 | #16 | Exceptional 4.7% |
| Slovenes | 99.9 /100 | #17 | Exceptional 4.7% |
| Immigrants | Venezuela | 99.9 /100 | #18 | Exceptional 4.7% |
| Scottish | 99.9 /100 | #19 | Exceptional 4.7% |
| Carpatho Rusyns | 99.9 /100 | #20 | Exceptional 4.7% |
| Welsh | 99.9 /100 | #21 | Exceptional 4.7% |