Lithuanian vs Immigrants from Cuba Disability Age 5 to 17
COMPARE
Lithuanian
Immigrants from Cuba
Disability Age 5 to 17
Disability Age 5 to 17 Comparison
Lithuanians
Immigrants from Cuba
5.8%
DISABILITY AGE 5 TO 17
6.7/ 100
METRIC RATING
221st/ 347
METRIC RANK
5.2%
DISABILITY AGE 5 TO 17
99.6/ 100
METRIC RATING
78th/ 347
METRIC RANK
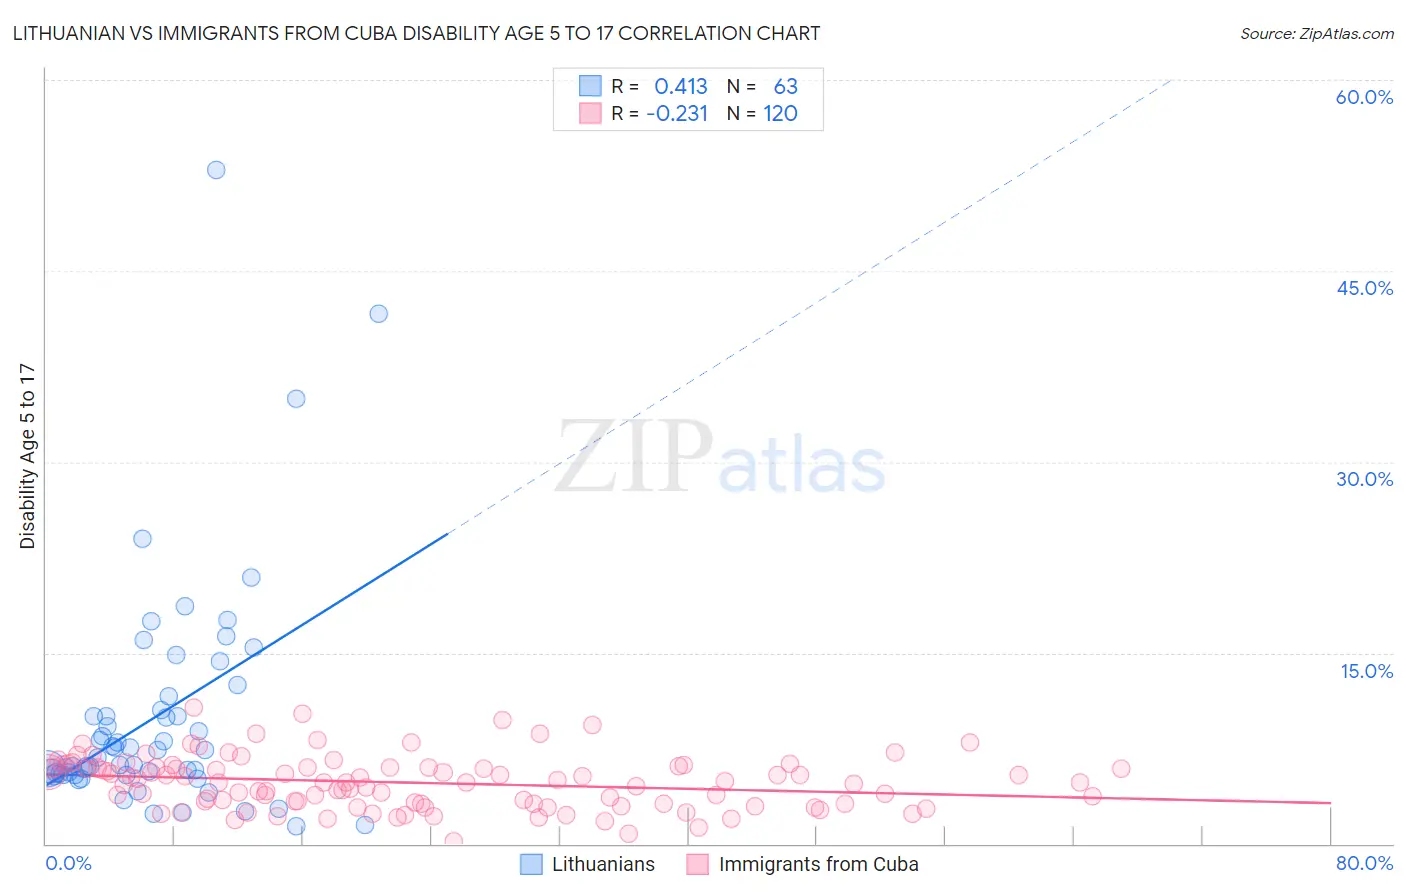
Lithuanian vs Immigrants from Cuba Disability Age 5 to 17 Correlation Chart
The statistical analysis conducted on geographies consisting of 416,867,041 people shows a moderate positive correlation between the proportion of Lithuanians and percentage of population with a disability between the ages 5 and 17 in the United States with a correlation coefficient (R) of 0.413 and weighted average of 5.8%. Similarly, the statistical analysis conducted on geographies consisting of 323,753,754 people shows a weak negative correlation between the proportion of Immigrants from Cuba and percentage of population with a disability between the ages 5 and 17 in the United States with a correlation coefficient (R) of -0.231 and weighted average of 5.2%, a difference of 10.8%.
Disability Age 5 to 17 Correlation Summary
| Measurement | Lithuanian | Immigrants from Cuba |
| Minimum | 1.4% | 0.17% |
| Maximum | 52.9% | 10.7% |
| Range | 51.6% | 10.6% |
| Mean | 9.9% | 4.8% |
| Median | 6.7% | 4.8% |
| Interquartile 25% (IQ1) | 5.4% | 3.2% |
| Interquartile 75% (IQ3) | 10.5% | 6.0% |
| Interquartile Range (IQR) | 5.0% | 2.8% |
| Standard Deviation (Sample) | 9.1% | 2.0% |
| Standard Deviation (Population) | 9.0% | 2.0% |
Similar Demographics by Disability Age 5 to 17
Demographics Similar to Lithuanians by Disability Age 5 to 17
In terms of disability age 5 to 17, the demographic groups most similar to Lithuanians are Immigrants from Sudan (5.8%, a difference of 0.0%), Belgian (5.8%, a difference of 0.040%), Sierra Leonean (5.8%, a difference of 0.050%), Immigrants from Sierra Leone (5.8%, a difference of 0.070%), and Czech (5.8%, a difference of 0.12%).
| Demographics | Rating | Rank | Disability Age 5 to 17 |
| Immigrants | Morocco | 8.3 /100 | #214 | Tragic 5.8% |
| Swedes | 8.1 /100 | #215 | Tragic 5.8% |
| Nigerians | 7.5 /100 | #216 | Tragic 5.8% |
| Czechs | 7.4 /100 | #217 | Tragic 5.8% |
| Immigrants | Sierra Leone | 7.1 /100 | #218 | Tragic 5.8% |
| Sierra Leoneans | 7.0 /100 | #219 | Tragic 5.8% |
| Belgians | 6.9 /100 | #220 | Tragic 5.8% |
| Lithuanians | 6.7 /100 | #221 | Tragic 5.8% |
| Immigrants | Sudan | 6.7 /100 | #222 | Tragic 5.8% |
| Alsatians | 6.0 /100 | #223 | Tragic 5.8% |
| Mexicans | 5.7 /100 | #224 | Tragic 5.8% |
| Guamanians/Chamorros | 5.6 /100 | #225 | Tragic 5.8% |
| British West Indians | 5.4 /100 | #226 | Tragic 5.8% |
| Swiss | 5.1 /100 | #227 | Tragic 5.8% |
| Haitians | 4.8 /100 | #228 | Tragic 5.8% |
Demographics Similar to Immigrants from Cuba by Disability Age 5 to 17
In terms of disability age 5 to 17, the demographic groups most similar to Immigrants from Cuba are Immigrants from Kazakhstan (5.2%, a difference of 0.010%), Immigrants from Guyana (5.2%, a difference of 0.040%), Afghan (5.2%, a difference of 0.040%), Sri Lankan (5.2%, a difference of 0.060%), and Immigrants from Moldova (5.2%, a difference of 0.070%).
| Demographics | Rating | Rank | Disability Age 5 to 17 |
| Jordanians | 99.7 /100 | #71 | Exceptional 5.2% |
| Immigrants | Vietnam | 99.7 /100 | #72 | Exceptional 5.2% |
| Immigrants | Czechoslovakia | 99.7 /100 | #73 | Exceptional 5.2% |
| Immigrants | Romania | 99.7 /100 | #74 | Exceptional 5.2% |
| Immigrants | Moldova | 99.6 /100 | #75 | Exceptional 5.2% |
| Immigrants | Guyana | 99.6 /100 | #76 | Exceptional 5.2% |
| Immigrants | Kazakhstan | 99.6 /100 | #77 | Exceptional 5.2% |
| Immigrants | Cuba | 99.6 /100 | #78 | Exceptional 5.2% |
| Afghans | 99.6 /100 | #79 | Exceptional 5.2% |
| Sri Lankans | 99.6 /100 | #80 | Exceptional 5.2% |
| Native Hawaiians | 99.6 /100 | #81 | Exceptional 5.2% |
| Immigrants | Sweden | 99.5 /100 | #82 | Exceptional 5.2% |
| Immigrants | France | 99.5 /100 | #83 | Exceptional 5.2% |
| Immigrants | Nicaragua | 99.5 /100 | #84 | Exceptional 5.2% |
| Bulgarians | 99.4 /100 | #85 | Exceptional 5.2% |