Hispanic or Latino vs Alsatian Disability Age 5 to 17
COMPARE
Hispanic or Latino
Alsatian
Disability Age 5 to 17
Disability Age 5 to 17 Comparison
Hispanics or Latinos
Alsatians
5.9%
DISABILITY AGE 5 TO 17
1.0/ 100
METRIC RATING
257th/ 347
METRIC RANK
5.8%
DISABILITY AGE 5 TO 17
6.0/ 100
METRIC RATING
223rd/ 347
METRIC RANK
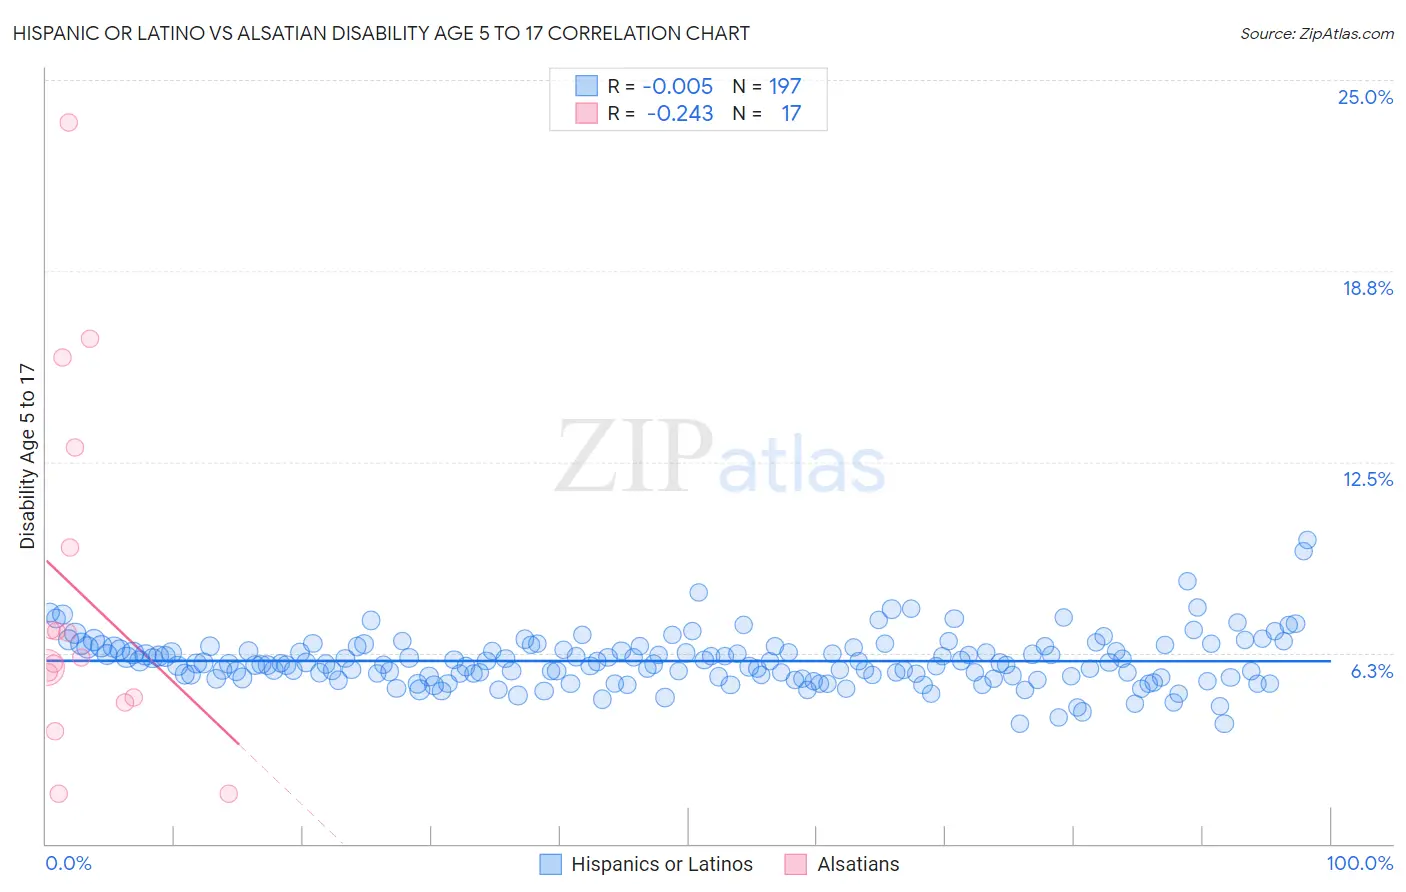
Hispanic or Latino vs Alsatian Disability Age 5 to 17 Correlation Chart
The statistical analysis conducted on geographies consisting of 559,956,499 people shows no correlation between the proportion of Hispanics or Latinos and percentage of population with a disability between the ages 5 and 17 in the United States with a correlation coefficient (R) of -0.005 and weighted average of 5.9%. Similarly, the statistical analysis conducted on geographies consisting of 82,434,825 people shows a weak negative correlation between the proportion of Alsatians and percentage of population with a disability between the ages 5 and 17 in the United States with a correlation coefficient (R) of -0.243 and weighted average of 5.8%, a difference of 2.3%.
Disability Age 5 to 17 Correlation Summary
| Measurement | Hispanic or Latino | Alsatian |
| Minimum | 3.9% | 1.6% |
| Maximum | 9.9% | 23.6% |
| Range | 6.0% | 22.0% |
| Mean | 6.0% | 8.2% |
| Median | 5.9% | 6.1% |
| Interquartile 25% (IQ1) | 5.5% | 4.7% |
| Interquartile 75% (IQ3) | 6.4% | 11.3% |
| Interquartile Range (IQR) | 0.96% | 6.6% |
| Standard Deviation (Sample) | 0.85% | 5.9% |
| Standard Deviation (Population) | 0.84% | 5.7% |
Similar Demographics by Disability Age 5 to 17
Demographics Similar to Hispanics or Latinos by Disability Age 5 to 17
In terms of disability age 5 to 17, the demographic groups most similar to Hispanics or Latinos are Brazilian (5.9%, a difference of 0.040%), Hopi (5.9%, a difference of 0.090%), Slavic (5.9%, a difference of 0.090%), Somali (5.9%, a difference of 0.22%), and Italian (5.9%, a difference of 0.28%).
| Demographics | Rating | Rank | Disability Age 5 to 17 |
| Poles | 1.5 /100 | #250 | Tragic 5.9% |
| Immigrants | Cambodia | 1.5 /100 | #251 | Tragic 5.9% |
| Hondurans | 1.5 /100 | #252 | Tragic 5.9% |
| Scandinavians | 1.4 /100 | #253 | Tragic 5.9% |
| Barbadians | 1.3 /100 | #254 | Tragic 5.9% |
| Italians | 1.2 /100 | #255 | Tragic 5.9% |
| Hopi | 1.0 /100 | #256 | Tragic 5.9% |
| Hispanics or Latinos | 1.0 /100 | #257 | Tragic 5.9% |
| Brazilians | 0.9 /100 | #258 | Tragic 5.9% |
| Slavs | 0.9 /100 | #259 | Tragic 5.9% |
| Somalis | 0.8 /100 | #260 | Tragic 5.9% |
| Immigrants | Middle Africa | 0.7 /100 | #261 | Tragic 5.9% |
| Immigrants | Western Africa | 0.7 /100 | #262 | Tragic 5.9% |
| Czechoslovakians | 0.7 /100 | #263 | Tragic 5.9% |
| Canadians | 0.6 /100 | #264 | Tragic 6.0% |
Demographics Similar to Alsatians by Disability Age 5 to 17
In terms of disability age 5 to 17, the demographic groups most similar to Alsatians are Mexican (5.8%, a difference of 0.060%), Guamanian/Chamorro (5.8%, a difference of 0.080%), British West Indian (5.8%, a difference of 0.12%), Lithuanian (5.8%, a difference of 0.15%), and Immigrants from Sudan (5.8%, a difference of 0.15%).
| Demographics | Rating | Rank | Disability Age 5 to 17 |
| Nigerians | 7.5 /100 | #216 | Tragic 5.8% |
| Czechs | 7.4 /100 | #217 | Tragic 5.8% |
| Immigrants | Sierra Leone | 7.1 /100 | #218 | Tragic 5.8% |
| Sierra Leoneans | 7.0 /100 | #219 | Tragic 5.8% |
| Belgians | 6.9 /100 | #220 | Tragic 5.8% |
| Lithuanians | 6.7 /100 | #221 | Tragic 5.8% |
| Immigrants | Sudan | 6.7 /100 | #222 | Tragic 5.8% |
| Alsatians | 6.0 /100 | #223 | Tragic 5.8% |
| Mexicans | 5.7 /100 | #224 | Tragic 5.8% |
| Guamanians/Chamorros | 5.6 /100 | #225 | Tragic 5.8% |
| British West Indians | 5.4 /100 | #226 | Tragic 5.8% |
| Swiss | 5.1 /100 | #227 | Tragic 5.8% |
| Haitians | 4.8 /100 | #228 | Tragic 5.8% |
| Bangladeshis | 4.8 /100 | #229 | Tragic 5.8% |
| Ghanaians | 4.7 /100 | #230 | Tragic 5.8% |