Hispanic or Latino vs Immigrants from Latvia Disability Age 5 to 17
COMPARE
Hispanic or Latino
Immigrants from Latvia
Disability Age 5 to 17
Disability Age 5 to 17 Comparison
Hispanics or Latinos
Immigrants from Latvia
5.9%
DISABILITY AGE 5 TO 17
1.0/ 100
METRIC RATING
257th/ 347
METRIC RANK
5.3%
DISABILITY AGE 5 TO 17
97.9/ 100
METRIC RATING
112th/ 347
METRIC RANK
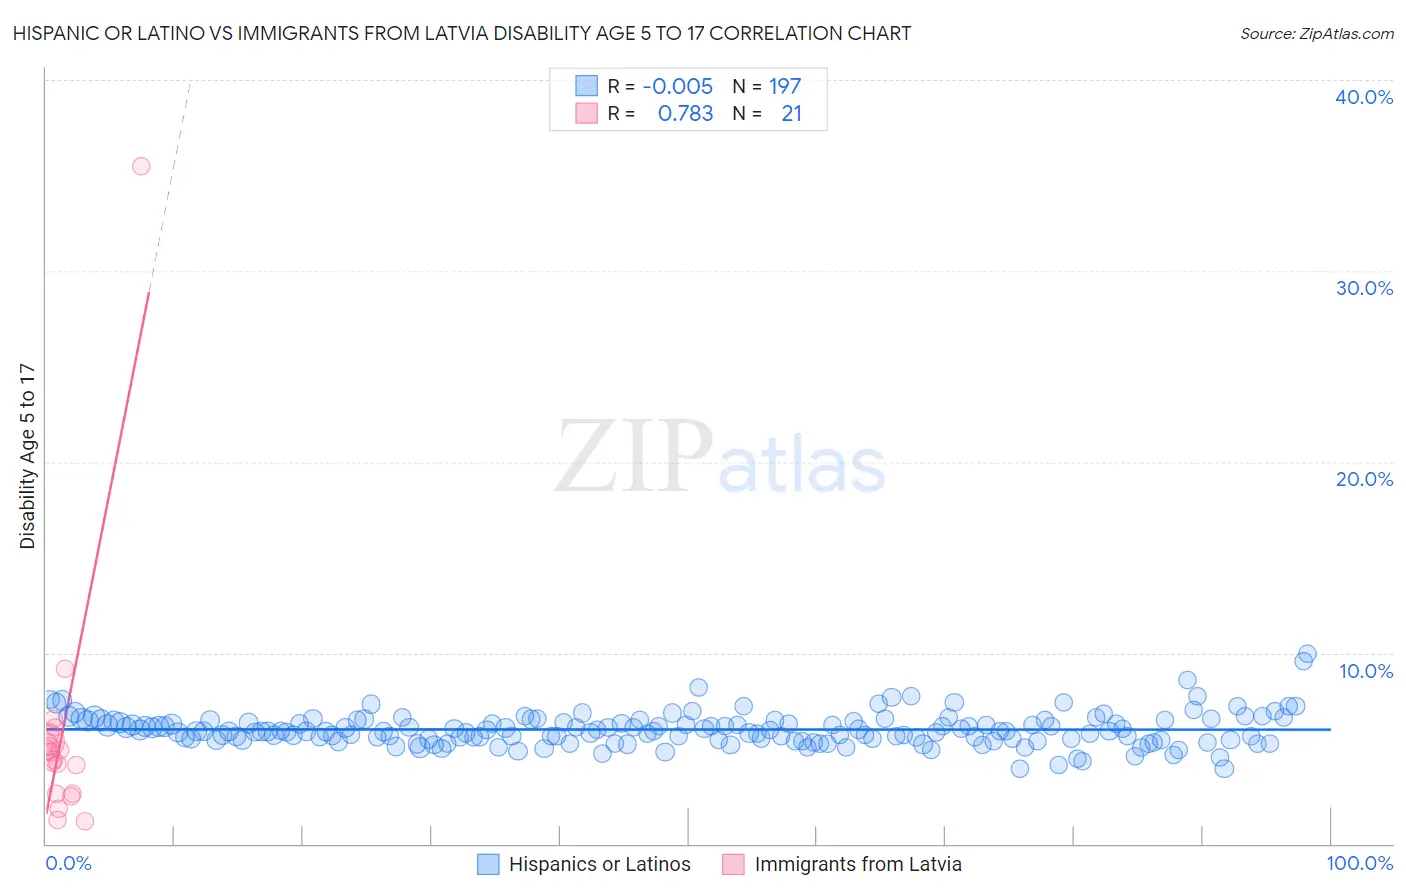
Hispanic or Latino vs Immigrants from Latvia Disability Age 5 to 17 Correlation Chart
The statistical analysis conducted on geographies consisting of 559,956,499 people shows no correlation between the proportion of Hispanics or Latinos and percentage of population with a disability between the ages 5 and 17 in the United States with a correlation coefficient (R) of -0.005 and weighted average of 5.9%. Similarly, the statistical analysis conducted on geographies consisting of 113,351,045 people shows a strong positive correlation between the proportion of Immigrants from Latvia and percentage of population with a disability between the ages 5 and 17 in the United States with a correlation coefficient (R) of 0.783 and weighted average of 5.3%, a difference of 11.0%.
Disability Age 5 to 17 Correlation Summary
| Measurement | Hispanic or Latino | Immigrants from Latvia |
| Minimum | 3.9% | 1.2% |
| Maximum | 9.9% | 35.5% |
| Range | 6.0% | 34.4% |
| Mean | 6.0% | 5.8% |
| Median | 5.9% | 4.8% |
| Interquartile 25% (IQ1) | 5.5% | 2.6% |
| Interquartile 75% (IQ3) | 6.4% | 5.6% |
| Interquartile Range (IQR) | 0.96% | 2.9% |
| Standard Deviation (Sample) | 0.85% | 7.1% |
| Standard Deviation (Population) | 0.84% | 6.9% |
Similar Demographics by Disability Age 5 to 17
Demographics Similar to Hispanics or Latinos by Disability Age 5 to 17
In terms of disability age 5 to 17, the demographic groups most similar to Hispanics or Latinos are Brazilian (5.9%, a difference of 0.040%), Hopi (5.9%, a difference of 0.090%), Slavic (5.9%, a difference of 0.090%), Somali (5.9%, a difference of 0.22%), and Italian (5.9%, a difference of 0.28%).
| Demographics | Rating | Rank | Disability Age 5 to 17 |
| Poles | 1.5 /100 | #250 | Tragic 5.9% |
| Immigrants | Cambodia | 1.5 /100 | #251 | Tragic 5.9% |
| Hondurans | 1.5 /100 | #252 | Tragic 5.9% |
| Scandinavians | 1.4 /100 | #253 | Tragic 5.9% |
| Barbadians | 1.3 /100 | #254 | Tragic 5.9% |
| Italians | 1.2 /100 | #255 | Tragic 5.9% |
| Hopi | 1.0 /100 | #256 | Tragic 5.9% |
| Hispanics or Latinos | 1.0 /100 | #257 | Tragic 5.9% |
| Brazilians | 0.9 /100 | #258 | Tragic 5.9% |
| Slavs | 0.9 /100 | #259 | Tragic 5.9% |
| Somalis | 0.8 /100 | #260 | Tragic 5.9% |
| Immigrants | Middle Africa | 0.7 /100 | #261 | Tragic 5.9% |
| Immigrants | Western Africa | 0.7 /100 | #262 | Tragic 5.9% |
| Czechoslovakians | 0.7 /100 | #263 | Tragic 5.9% |
| Canadians | 0.6 /100 | #264 | Tragic 6.0% |
Demographics Similar to Immigrants from Latvia by Disability Age 5 to 17
In terms of disability age 5 to 17, the demographic groups most similar to Immigrants from Latvia are Ethiopian (5.3%, a difference of 0.020%), Aleut (5.3%, a difference of 0.040%), Immigrants from Eritrea (5.3%, a difference of 0.050%), Immigrants from Northern Europe (5.3%, a difference of 0.070%), and Cuban (5.3%, a difference of 0.080%).
| Demographics | Rating | Rank | Disability Age 5 to 17 |
| Immigrants | Italy | 98.4 /100 | #105 | Exceptional 5.3% |
| Immigrants | Yemen | 98.2 /100 | #106 | Exceptional 5.3% |
| Russians | 98.2 /100 | #107 | Exceptional 5.3% |
| Immigrants | South Africa | 98.1 /100 | #108 | Exceptional 5.3% |
| Immigrants | Northern Africa | 98.1 /100 | #109 | Exceptional 5.3% |
| Immigrants | Eritrea | 98.0 /100 | #110 | Exceptional 5.3% |
| Ethiopians | 97.9 /100 | #111 | Exceptional 5.3% |
| Immigrants | Latvia | 97.9 /100 | #112 | Exceptional 5.3% |
| Aleuts | 97.8 /100 | #113 | Exceptional 5.3% |
| Immigrants | Northern Europe | 97.8 /100 | #114 | Exceptional 5.3% |
| Cubans | 97.8 /100 | #115 | Exceptional 5.3% |
| Cypriots | 97.7 /100 | #116 | Exceptional 5.3% |
| Immigrants | Afghanistan | 97.4 /100 | #117 | Exceptional 5.3% |
| South Americans | 97.1 /100 | #118 | Exceptional 5.4% |
| Immigrants | South America | 97.1 /100 | #119 | Exceptional 5.4% |