Hispanic or Latino vs Cheyenne Disability Age 5 to 17
COMPARE
Hispanic or Latino
Cheyenne
Disability Age 5 to 17
Disability Age 5 to 17 Comparison
Hispanics or Latinos
Cheyenne
5.9%
DISABILITY AGE 5 TO 17
1.0/ 100
METRIC RATING
257th/ 347
METRIC RANK
6.0%
DISABILITY AGE 5 TO 17
0.2/ 100
METRIC RATING
274th/ 347
METRIC RANK
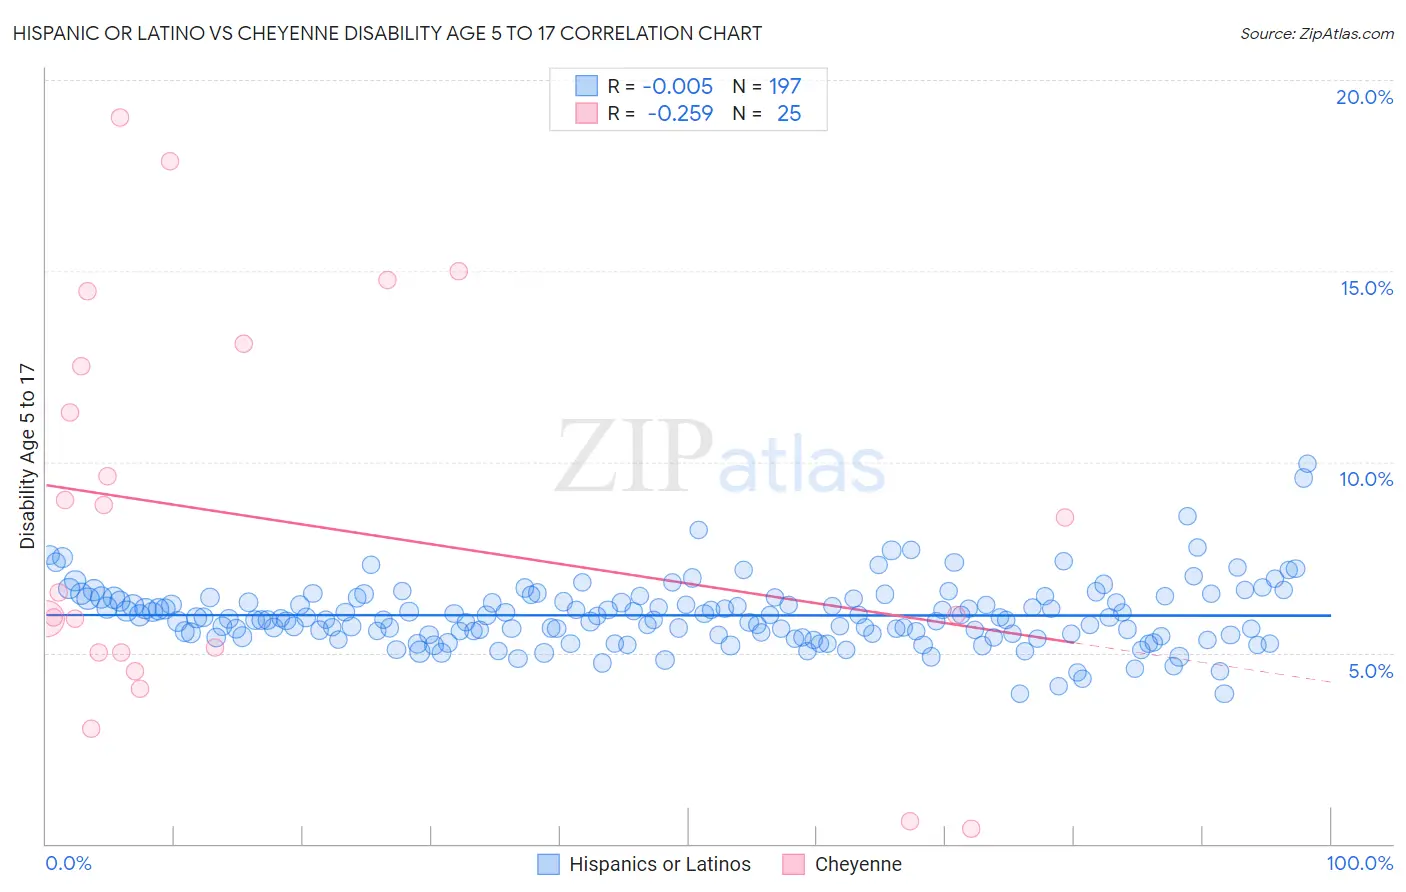
Hispanic or Latino vs Cheyenne Disability Age 5 to 17 Correlation Chart
The statistical analysis conducted on geographies consisting of 559,956,499 people shows no correlation between the proportion of Hispanics or Latinos and percentage of population with a disability between the ages 5 and 17 in the United States with a correlation coefficient (R) of -0.005 and weighted average of 5.9%. Similarly, the statistical analysis conducted on geographies consisting of 80,502,855 people shows a weak negative correlation between the proportion of Cheyenne and percentage of population with a disability between the ages 5 and 17 in the United States with a correlation coefficient (R) of -0.259 and weighted average of 6.0%, a difference of 2.0%.
Disability Age 5 to 17 Correlation Summary
| Measurement | Hispanic or Latino | Cheyenne |
| Minimum | 3.9% | 0.39% |
| Maximum | 9.9% | 19.0% |
| Range | 6.0% | 18.6% |
| Mean | 6.0% | 8.5% |
| Median | 5.9% | 6.6% |
| Interquartile 25% (IQ1) | 5.5% | 5.0% |
| Interquartile 75% (IQ3) | 6.4% | 12.8% |
| Interquartile Range (IQR) | 0.96% | 7.8% |
| Standard Deviation (Sample) | 0.85% | 5.1% |
| Standard Deviation (Population) | 0.84% | 5.0% |
Demographics Similar to Hispanics or Latinos and Cheyenne by Disability Age 5 to 17
In terms of disability age 5 to 17, the demographic groups most similar to Hispanics or Latinos are Brazilian (5.9%, a difference of 0.040%), Hopi (5.9%, a difference of 0.090%), Slavic (5.9%, a difference of 0.090%), Somali (5.9%, a difference of 0.22%), and Italian (5.9%, a difference of 0.28%). Similarly, the demographic groups most similar to Cheyenne are Alaska Native (6.0%, a difference of 0.11%), Dutch (6.0%, a difference of 0.11%), Finnish (6.0%, a difference of 0.16%), Immigrants from Zaire (6.0%, a difference of 0.19%), and Immigrants from Somalia (6.0%, a difference of 0.84%).
| Demographics | Rating | Rank | Disability Age 5 to 17 |
| Italians | 1.2 /100 | #255 | Tragic 5.9% |
| Hopi | 1.0 /100 | #256 | Tragic 5.9% |
| Hispanics or Latinos | 1.0 /100 | #257 | Tragic 5.9% |
| Brazilians | 0.9 /100 | #258 | Tragic 5.9% |
| Slavs | 0.9 /100 | #259 | Tragic 5.9% |
| Somalis | 0.8 /100 | #260 | Tragic 5.9% |
| Immigrants | Middle Africa | 0.7 /100 | #261 | Tragic 5.9% |
| Immigrants | Western Africa | 0.7 /100 | #262 | Tragic 5.9% |
| Czechoslovakians | 0.7 /100 | #263 | Tragic 5.9% |
| Canadians | 0.6 /100 | #264 | Tragic 6.0% |
| Panamanians | 0.6 /100 | #265 | Tragic 6.0% |
| Slovenes | 0.6 /100 | #266 | Tragic 6.0% |
| Spanish | 0.5 /100 | #267 | Tragic 6.0% |
| Sioux | 0.4 /100 | #268 | Tragic 6.0% |
| Liberians | 0.4 /100 | #269 | Tragic 6.0% |
| Immigrants | Somalia | 0.4 /100 | #270 | Tragic 6.0% |
| Immigrants | Zaire | 0.2 /100 | #271 | Tragic 6.0% |
| Finns | 0.2 /100 | #272 | Tragic 6.0% |
| Alaska Natives | 0.2 /100 | #273 | Tragic 6.0% |
| Cheyenne | 0.2 /100 | #274 | Tragic 6.0% |
| Dutch | 0.2 /100 | #275 | Tragic 6.0% |