Hawaiian vs Trinidadian and Tobagonian Male Disability
COMPARE
Hawaiian
Trinidadian and Tobagonian
Male Disability
Male Disability Comparison
Hawaiians
Trinidadians and Tobagonians
12.3%
MALE DISABILITY
0.1/ 100
METRIC RATING
266th/ 347
METRIC RANK
11.0%
MALE DISABILITY
83.3/ 100
METRIC RATING
135th/ 347
METRIC RANK
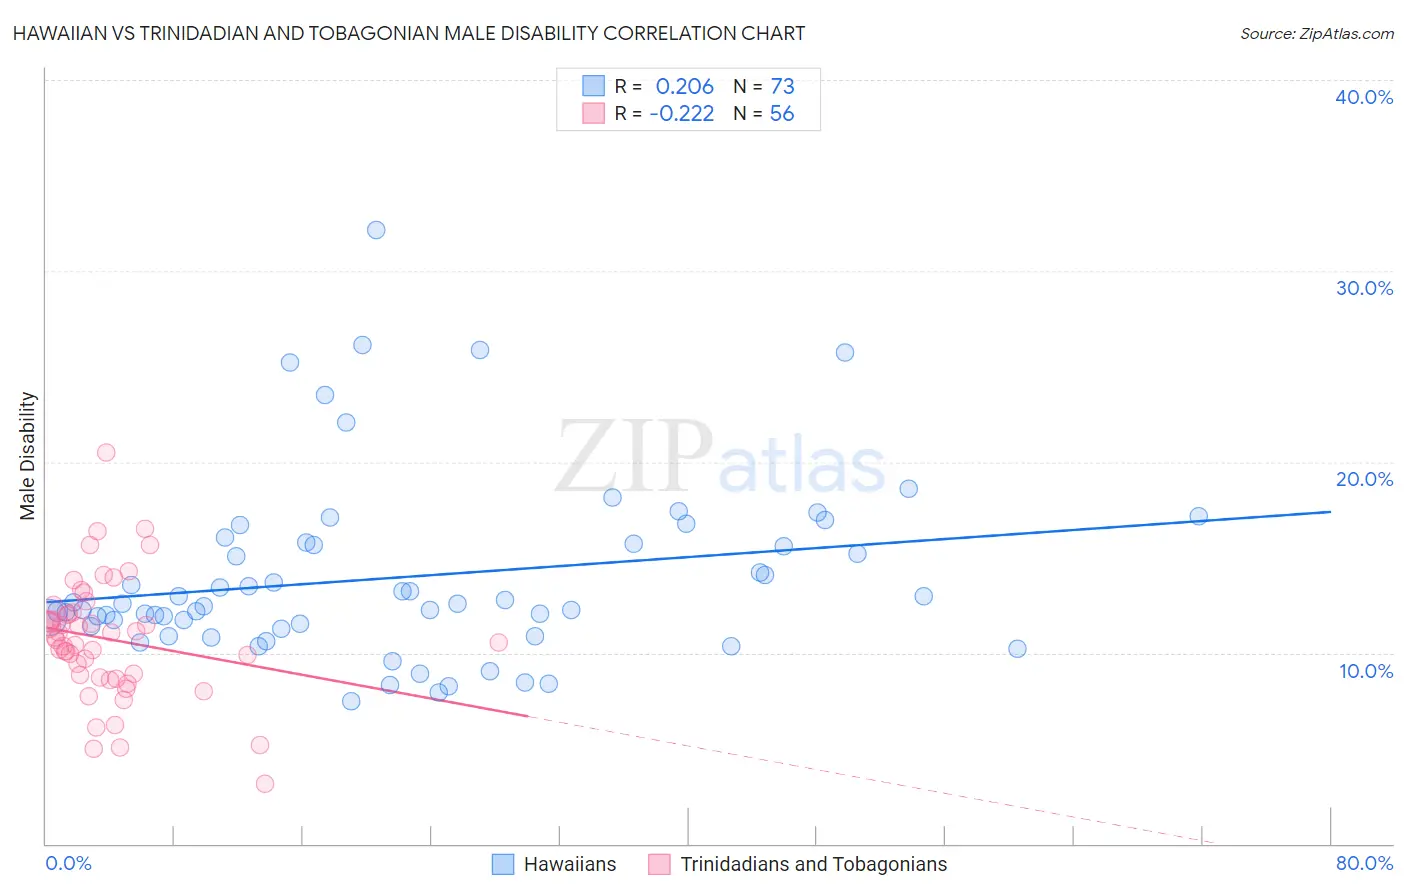
Hawaiian vs Trinidadian and Tobagonian Male Disability Correlation Chart
The statistical analysis conducted on geographies consisting of 327,496,415 people shows a weak positive correlation between the proportion of Hawaiians and percentage of males with a disability in the United States with a correlation coefficient (R) of 0.206 and weighted average of 12.3%. Similarly, the statistical analysis conducted on geographies consisting of 219,818,350 people shows a weak negative correlation between the proportion of Trinidadians and Tobagonians and percentage of males with a disability in the United States with a correlation coefficient (R) of -0.222 and weighted average of 11.0%, a difference of 11.8%.
Male Disability Correlation Summary
| Measurement | Hawaiian | Trinidadian and Tobagonian |
| Minimum | 7.5% | 3.1% |
| Maximum | 32.2% | 20.5% |
| Range | 24.7% | 17.4% |
| Mean | 14.0% | 10.7% |
| Median | 12.6% | 10.8% |
| Interquartile 25% (IQ1) | 11.3% | 8.8% |
| Interquartile 75% (IQ3) | 15.7% | 12.1% |
| Interquartile Range (IQR) | 4.4% | 3.3% |
| Standard Deviation (Sample) | 4.7% | 3.1% |
| Standard Deviation (Population) | 4.7% | 3.1% |
Similar Demographics by Male Disability
Demographics Similar to Hawaiians by Male Disability
In terms of male disability, the demographic groups most similar to Hawaiians are Immigrants from Portugal (12.3%, a difference of 0.020%), Immigrants from Germany (12.3%, a difference of 0.050%), Portuguese (12.3%, a difference of 0.18%), Czechoslovakian (12.3%, a difference of 0.18%), and Spaniard (12.3%, a difference of 0.26%).
| Demographics | Rating | Rank | Male Disability |
| Belgians | 0.3 /100 | #259 | Tragic 12.1% |
| Swedes | 0.3 /100 | #260 | Tragic 12.1% |
| Slavs | 0.2 /100 | #261 | Tragic 12.2% |
| Norwegians | 0.2 /100 | #262 | Tragic 12.2% |
| Canadians | 0.2 /100 | #263 | Tragic 12.2% |
| Nepalese | 0.2 /100 | #264 | Tragic 12.2% |
| Immigrants | Portugal | 0.1 /100 | #265 | Tragic 12.3% |
| Hawaiians | 0.1 /100 | #266 | Tragic 12.3% |
| Immigrants | Germany | 0.1 /100 | #267 | Tragic 12.3% |
| Portuguese | 0.1 /100 | #268 | Tragic 12.3% |
| Czechoslovakians | 0.1 /100 | #269 | Tragic 12.3% |
| Spaniards | 0.1 /100 | #270 | Tragic 12.3% |
| Scandinavians | 0.1 /100 | #271 | Tragic 12.3% |
| Hmong | 0.0 /100 | #272 | Tragic 12.5% |
| Native Hawaiians | 0.0 /100 | #273 | Tragic 12.5% |
Demographics Similar to Trinidadians and Tobagonians by Male Disability
In terms of male disability, the demographic groups most similar to Trinidadians and Tobagonians are Bhutanese (11.0%, a difference of 0.010%), Immigrants from Costa Rica (11.0%, a difference of 0.040%), Ugandan (11.0%, a difference of 0.070%), Immigrants from Fiji (11.0%, a difference of 0.080%), and Macedonian (11.0%, a difference of 0.10%).
| Demographics | Rating | Rank | Male Disability |
| Immigrants | Latvia | 85.5 /100 | #128 | Excellent 10.9% |
| Immigrants | Philippines | 85.4 /100 | #129 | Excellent 10.9% |
| Brazilians | 85.4 /100 | #130 | Excellent 10.9% |
| Macedonians | 84.2 /100 | #131 | Excellent 11.0% |
| Immigrants | Fiji | 84.0 /100 | #132 | Excellent 11.0% |
| Ugandans | 83.9 /100 | #133 | Excellent 11.0% |
| Bhutanese | 83.4 /100 | #134 | Excellent 11.0% |
| Trinidadians and Tobagonians | 83.3 /100 | #135 | Excellent 11.0% |
| Immigrants | Costa Rica | 82.8 /100 | #136 | Excellent 11.0% |
| Immigrants | Europe | 82.0 /100 | #137 | Excellent 11.0% |
| Nigerians | 81.9 /100 | #138 | Excellent 11.0% |
| South Africans | 81.7 /100 | #139 | Excellent 11.0% |
| Immigrants | Italy | 81.5 /100 | #140 | Excellent 11.0% |
| Arabs | 81.5 /100 | #141 | Excellent 11.0% |
| Immigrants | Sudan | 81.5 /100 | #142 | Excellent 11.0% |