Paiute vs Trinidadian and Tobagonian Male Disability
COMPARE
Paiute
Trinidadian and Tobagonian
Male Disability
Male Disability Comparison
Paiute
Trinidadians and Tobagonians
13.7%
MALE DISABILITY
0.0/ 100
METRIC RATING
317th/ 347
METRIC RANK
11.0%
MALE DISABILITY
83.3/ 100
METRIC RATING
135th/ 347
METRIC RANK
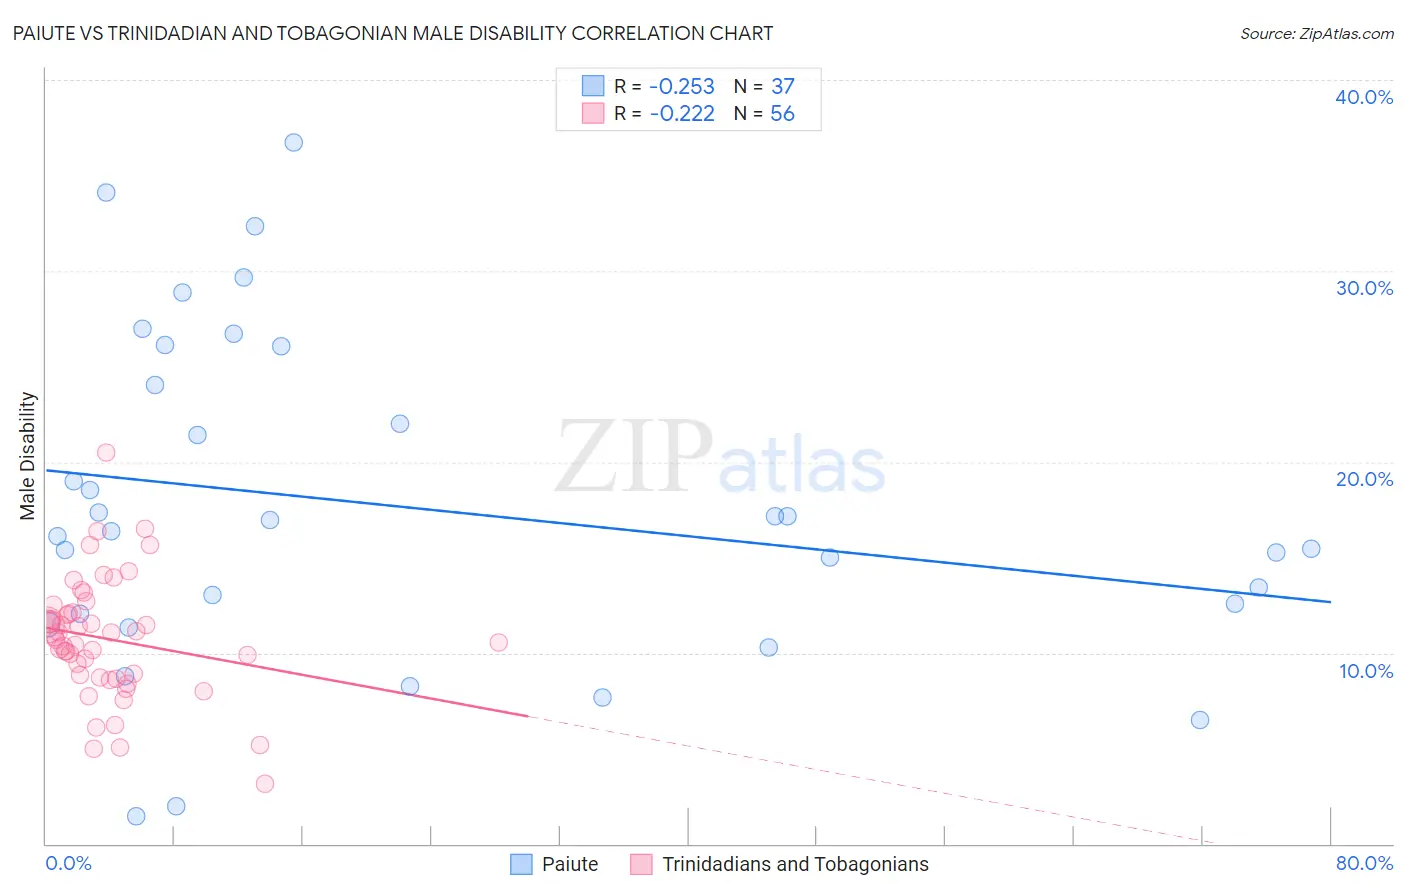
Paiute vs Trinidadian and Tobagonian Male Disability Correlation Chart
The statistical analysis conducted on geographies consisting of 58,394,227 people shows a weak negative correlation between the proportion of Paiute and percentage of males with a disability in the United States with a correlation coefficient (R) of -0.253 and weighted average of 13.7%. Similarly, the statistical analysis conducted on geographies consisting of 219,818,350 people shows a weak negative correlation between the proportion of Trinidadians and Tobagonians and percentage of males with a disability in the United States with a correlation coefficient (R) of -0.222 and weighted average of 11.0%, a difference of 24.8%.
Male Disability Correlation Summary
| Measurement | Paiute | Trinidadian and Tobagonian |
| Minimum | 1.5% | 3.1% |
| Maximum | 36.7% | 20.5% |
| Range | 35.3% | 17.4% |
| Mean | 17.7% | 10.7% |
| Median | 16.4% | 10.8% |
| Interquartile 25% (IQ1) | 11.8% | 8.8% |
| Interquartile 75% (IQ3) | 25.0% | 12.1% |
| Interquartile Range (IQR) | 13.3% | 3.3% |
| Standard Deviation (Sample) | 8.6% | 3.1% |
| Standard Deviation (Population) | 8.5% | 3.1% |
Similar Demographics by Male Disability
Demographics Similar to Paiute by Male Disability
In terms of male disability, the demographic groups most similar to Paiute are Cree (13.7%, a difference of 0.21%), American (13.8%, a difference of 0.62%), Alaska Native (13.6%, a difference of 0.80%), Iroquois (13.6%, a difference of 0.86%), and Aleut (13.5%, a difference of 1.0%).
| Demographics | Rating | Rank | Male Disability |
| Immigrants | Azores | 0.0 /100 | #310 | Tragic 13.4% |
| Delaware | 0.0 /100 | #311 | Tragic 13.5% |
| Yakama | 0.0 /100 | #312 | Tragic 13.5% |
| Puget Sound Salish | 0.0 /100 | #313 | Tragic 13.5% |
| Aleuts | 0.0 /100 | #314 | Tragic 13.5% |
| Iroquois | 0.0 /100 | #315 | Tragic 13.6% |
| Alaska Natives | 0.0 /100 | #316 | Tragic 13.6% |
| Paiute | 0.0 /100 | #317 | Tragic 13.7% |
| Cree | 0.0 /100 | #318 | Tragic 13.7% |
| Americans | 0.0 /100 | #319 | Tragic 13.8% |
| Tlingit-Haida | 0.0 /100 | #320 | Tragic 13.8% |
| Shoshone | 0.0 /100 | #321 | Tragic 13.8% |
| Apache | 0.0 /100 | #322 | Tragic 14.0% |
| Osage | 0.0 /100 | #323 | Tragic 14.0% |
| Comanche | 0.0 /100 | #324 | Tragic 14.1% |
Demographics Similar to Trinidadians and Tobagonians by Male Disability
In terms of male disability, the demographic groups most similar to Trinidadians and Tobagonians are Bhutanese (11.0%, a difference of 0.010%), Immigrants from Costa Rica (11.0%, a difference of 0.040%), Ugandan (11.0%, a difference of 0.070%), Immigrants from Fiji (11.0%, a difference of 0.080%), and Macedonian (11.0%, a difference of 0.10%).
| Demographics | Rating | Rank | Male Disability |
| Immigrants | Latvia | 85.5 /100 | #128 | Excellent 10.9% |
| Immigrants | Philippines | 85.4 /100 | #129 | Excellent 10.9% |
| Brazilians | 85.4 /100 | #130 | Excellent 10.9% |
| Macedonians | 84.2 /100 | #131 | Excellent 11.0% |
| Immigrants | Fiji | 84.0 /100 | #132 | Excellent 11.0% |
| Ugandans | 83.9 /100 | #133 | Excellent 11.0% |
| Bhutanese | 83.4 /100 | #134 | Excellent 11.0% |
| Trinidadians and Tobagonians | 83.3 /100 | #135 | Excellent 11.0% |
| Immigrants | Costa Rica | 82.8 /100 | #136 | Excellent 11.0% |
| Immigrants | Europe | 82.0 /100 | #137 | Excellent 11.0% |
| Nigerians | 81.9 /100 | #138 | Excellent 11.0% |
| South Africans | 81.7 /100 | #139 | Excellent 11.0% |
| Immigrants | Italy | 81.5 /100 | #140 | Excellent 11.0% |
| Arabs | 81.5 /100 | #141 | Excellent 11.0% |
| Immigrants | Sudan | 81.5 /100 | #142 | Excellent 11.0% |