Crow vs Trinidadian and Tobagonian Male Disability
COMPARE
Crow
Trinidadian and Tobagonian
Male Disability
Male Disability Comparison
Crow
Trinidadians and Tobagonians
13.1%
MALE DISABILITY
0.0/ 100
METRIC RATING
302nd/ 347
METRIC RANK
11.0%
MALE DISABILITY
83.3/ 100
METRIC RATING
135th/ 347
METRIC RANK
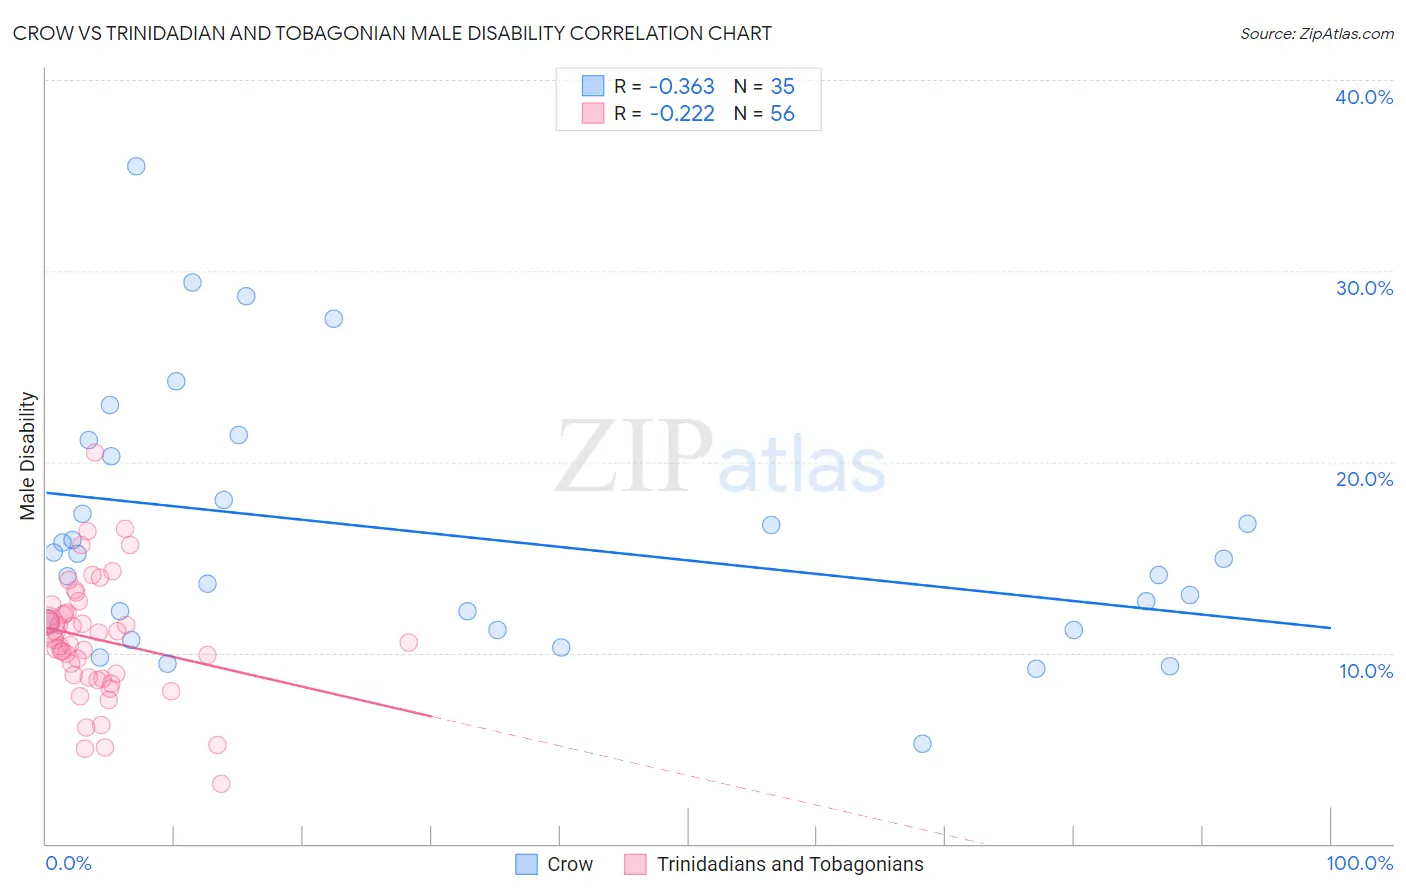
Crow vs Trinidadian and Tobagonian Male Disability Correlation Chart
The statistical analysis conducted on geographies consisting of 59,204,441 people shows a mild negative correlation between the proportion of Crow and percentage of males with a disability in the United States with a correlation coefficient (R) of -0.363 and weighted average of 13.1%. Similarly, the statistical analysis conducted on geographies consisting of 219,818,350 people shows a weak negative correlation between the proportion of Trinidadians and Tobagonians and percentage of males with a disability in the United States with a correlation coefficient (R) of -0.222 and weighted average of 11.0%, a difference of 19.6%.
Male Disability Correlation Summary
| Measurement | Crow | Trinidadian and Tobagonian |
| Minimum | 5.2% | 3.1% |
| Maximum | 35.5% | 20.5% |
| Range | 30.2% | 17.4% |
| Mean | 16.2% | 10.7% |
| Median | 14.9% | 10.8% |
| Interquartile 25% (IQ1) | 11.2% | 8.8% |
| Interquartile 75% (IQ3) | 20.3% | 12.1% |
| Interquartile Range (IQR) | 9.1% | 3.3% |
| Standard Deviation (Sample) | 6.7% | 3.1% |
| Standard Deviation (Population) | 6.6% | 3.1% |
Similar Demographics by Male Disability
Demographics Similar to Crow by Male Disability
In terms of male disability, the demographic groups most similar to Crow are Scotch-Irish (13.2%, a difference of 0.54%), French (13.0%, a difference of 0.58%), Cheyenne (13.0%, a difference of 0.63%), Celtic (13.0%, a difference of 0.72%), and Black/African American (13.2%, a difference of 0.87%).
| Demographics | Rating | Rank | Male Disability |
| Immigrants | Micronesia | 0.0 /100 | #295 | Tragic 12.9% |
| Immigrants | Nonimmigrants | 0.0 /100 | #296 | Tragic 12.9% |
| Inupiat | 0.0 /100 | #297 | Tragic 13.0% |
| Pennsylvania Germans | 0.0 /100 | #298 | Tragic 13.0% |
| Celtics | 0.0 /100 | #299 | Tragic 13.0% |
| Cheyenne | 0.0 /100 | #300 | Tragic 13.0% |
| French | 0.0 /100 | #301 | Tragic 13.0% |
| Crow | 0.0 /100 | #302 | Tragic 13.1% |
| Scotch-Irish | 0.0 /100 | #303 | Tragic 13.2% |
| Blacks/African Americans | 0.0 /100 | #304 | Tragic 13.2% |
| French Canadians | 0.0 /100 | #305 | Tragic 13.3% |
| Spanish Americans | 0.0 /100 | #306 | Tragic 13.3% |
| Arapaho | 0.0 /100 | #307 | Tragic 13.3% |
| French American Indians | 0.0 /100 | #308 | Tragic 13.4% |
| Blackfeet | 0.0 /100 | #309 | Tragic 13.4% |
Demographics Similar to Trinidadians and Tobagonians by Male Disability
In terms of male disability, the demographic groups most similar to Trinidadians and Tobagonians are Bhutanese (11.0%, a difference of 0.010%), Immigrants from Costa Rica (11.0%, a difference of 0.040%), Ugandan (11.0%, a difference of 0.070%), Immigrants from Fiji (11.0%, a difference of 0.080%), and Macedonian (11.0%, a difference of 0.10%).
| Demographics | Rating | Rank | Male Disability |
| Immigrants | Latvia | 85.5 /100 | #128 | Excellent 10.9% |
| Immigrants | Philippines | 85.4 /100 | #129 | Excellent 10.9% |
| Brazilians | 85.4 /100 | #130 | Excellent 10.9% |
| Macedonians | 84.2 /100 | #131 | Excellent 11.0% |
| Immigrants | Fiji | 84.0 /100 | #132 | Excellent 11.0% |
| Ugandans | 83.9 /100 | #133 | Excellent 11.0% |
| Bhutanese | 83.4 /100 | #134 | Excellent 11.0% |
| Trinidadians and Tobagonians | 83.3 /100 | #135 | Excellent 11.0% |
| Immigrants | Costa Rica | 82.8 /100 | #136 | Excellent 11.0% |
| Immigrants | Europe | 82.0 /100 | #137 | Excellent 11.0% |
| Nigerians | 81.9 /100 | #138 | Excellent 11.0% |
| South Africans | 81.7 /100 | #139 | Excellent 11.0% |
| Immigrants | Italy | 81.5 /100 | #140 | Excellent 11.0% |
| Arabs | 81.5 /100 | #141 | Excellent 11.0% |
| Immigrants | Sudan | 81.5 /100 | #142 | Excellent 11.0% |