Hawaiian vs Trinidadian and Tobagonian 7th Grade
COMPARE
Hawaiian
Trinidadian and Tobagonian
7th Grade
7th Grade Comparison
Hawaiians
Trinidadians and Tobagonians
95.8%
7TH GRADE
16.0/ 100
METRIC RATING
210th/ 347
METRIC RANK
95.2%
7TH GRADE
0.3/ 100
METRIC RATING
269th/ 347
METRIC RANK
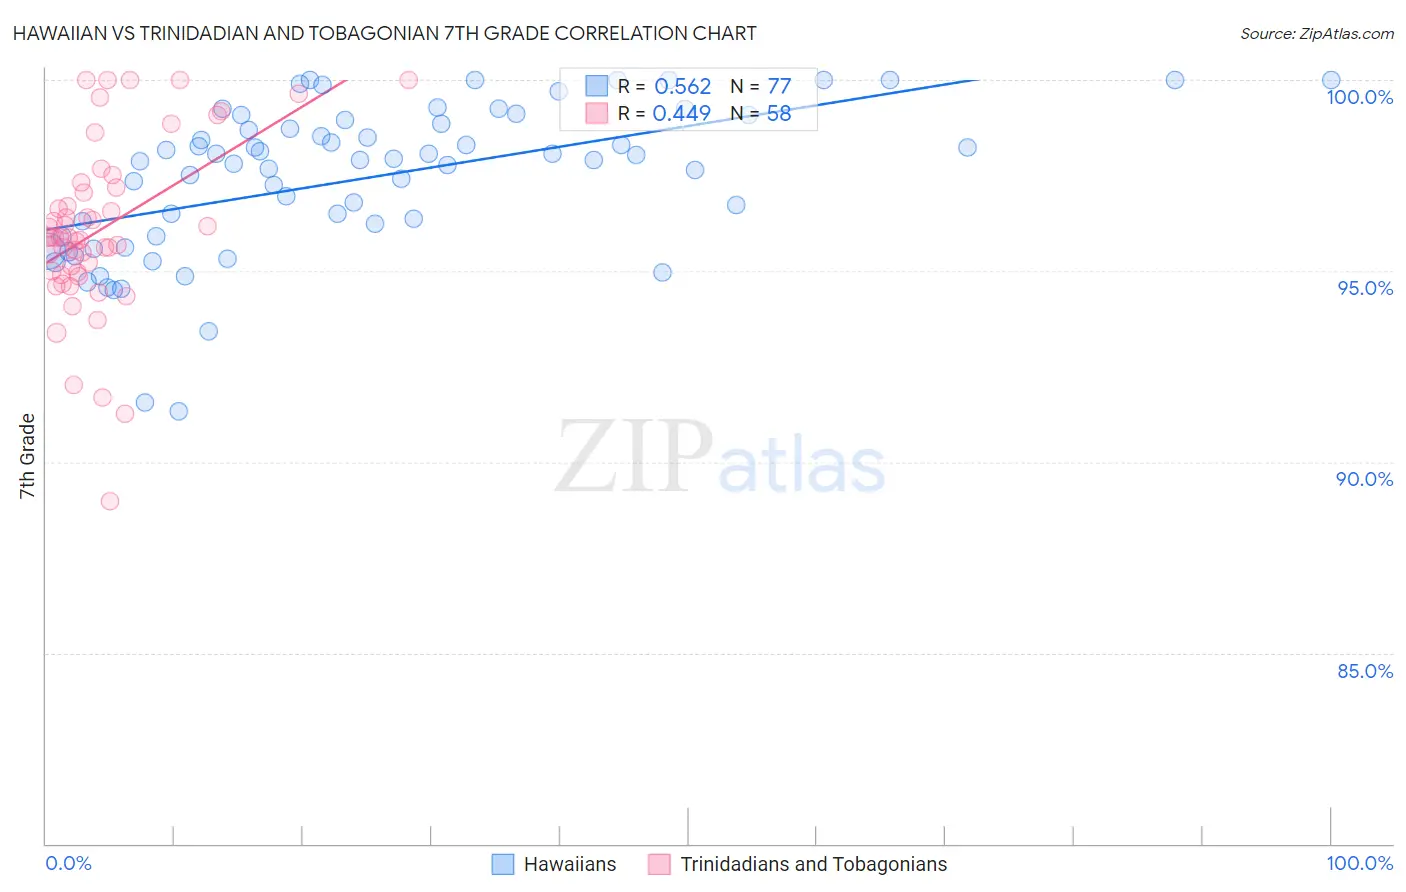
Hawaiian vs Trinidadian and Tobagonian 7th Grade Correlation Chart
The statistical analysis conducted on geographies consisting of 327,621,279 people shows a substantial positive correlation between the proportion of Hawaiians and percentage of population with at least 7th grade education in the United States with a correlation coefficient (R) of 0.562 and weighted average of 95.8%. Similarly, the statistical analysis conducted on geographies consisting of 219,881,170 people shows a moderate positive correlation between the proportion of Trinidadians and Tobagonians and percentage of population with at least 7th grade education in the United States with a correlation coefficient (R) of 0.449 and weighted average of 95.2%, a difference of 0.67%.
7th Grade Correlation Summary
| Measurement | Hawaiian | Trinidadian and Tobagonian |
| Minimum | 91.3% | 89.0% |
| Maximum | 100.0% | 100.0% |
| Range | 8.7% | 11.0% |
| Mean | 97.4% | 96.1% |
| Median | 97.9% | 95.9% |
| Interquartile 25% (IQ1) | 95.9% | 95.0% |
| Interquartile 75% (IQ3) | 98.9% | 97.2% |
| Interquartile Range (IQR) | 3.0% | 2.2% |
| Standard Deviation (Sample) | 2.0% | 2.3% |
| Standard Deviation (Population) | 2.0% | 2.2% |
Similar Demographics by 7th Grade
Demographics Similar to Hawaiians by 7th Grade
In terms of 7th grade, the demographic groups most similar to Hawaiians are Dutch West Indian (95.8%, a difference of 0.0%), Navajo (95.8%, a difference of 0.010%), Immigrants from Sudan (95.8%, a difference of 0.010%), African (95.8%, a difference of 0.020%), and Moroccan (95.8%, a difference of 0.030%).
| Demographics | Rating | Rank | 7th Grade |
| Comanche | 21.1 /100 | #203 | Fair 95.8% |
| Assyrians/Chaldeans/Syriacs | 20.5 /100 | #204 | Fair 95.8% |
| Moroccans | 18.9 /100 | #205 | Poor 95.8% |
| Africans | 17.6 /100 | #206 | Poor 95.8% |
| Navajo | 17.0 /100 | #207 | Poor 95.8% |
| Immigrants | Sudan | 17.0 /100 | #208 | Poor 95.8% |
| Dutch West Indians | 16.1 /100 | #209 | Poor 95.8% |
| Hawaiians | 16.0 /100 | #210 | Poor 95.8% |
| Portuguese | 13.6 /100 | #211 | Poor 95.8% |
| Immigrants | Lebanon | 13.0 /100 | #212 | Poor 95.8% |
| Immigrants | Morocco | 12.6 /100 | #213 | Poor 95.8% |
| Bahamians | 11.6 /100 | #214 | Poor 95.7% |
| Spanish Americans | 9.3 /100 | #215 | Tragic 95.7% |
| Immigrants | Chile | 9.1 /100 | #216 | Tragic 95.7% |
| Immigrants | Pakistan | 9.0 /100 | #217 | Tragic 95.7% |
Demographics Similar to Trinidadians and Tobagonians by 7th Grade
In terms of 7th grade, the demographic groups most similar to Trinidadians and Tobagonians are Immigrants from Hong Kong (95.2%, a difference of 0.020%), Houma (95.1%, a difference of 0.020%), Immigrants from South America (95.1%, a difference of 0.020%), Peruvian (95.1%, a difference of 0.020%), and Immigrants from Uzbekistan (95.1%, a difference of 0.020%).
| Demographics | Rating | Rank | 7th Grade |
| Immigrants | Somalia | 0.5 /100 | #262 | Tragic 95.2% |
| West Indians | 0.5 /100 | #263 | Tragic 95.2% |
| Immigrants | Nigeria | 0.4 /100 | #264 | Tragic 95.2% |
| Immigrants | Uruguay | 0.3 /100 | #265 | Tragic 95.2% |
| Immigrants | Ghana | 0.3 /100 | #266 | Tragic 95.2% |
| Yuman | 0.3 /100 | #267 | Tragic 95.2% |
| Immigrants | Hong Kong | 0.3 /100 | #268 | Tragic 95.2% |
| Trinidadians and Tobagonians | 0.3 /100 | #269 | Tragic 95.2% |
| Houma | 0.2 /100 | #270 | Tragic 95.1% |
| Immigrants | South America | 0.2 /100 | #271 | Tragic 95.1% |
| Peruvians | 0.2 /100 | #272 | Tragic 95.1% |
| Immigrants | Uzbekistan | 0.2 /100 | #273 | Tragic 95.1% |
| Immigrants | Western Africa | 0.2 /100 | #274 | Tragic 95.1% |
| Immigrants | Colombia | 0.2 /100 | #275 | Tragic 95.1% |
| Immigrants | Thailand | 0.2 /100 | #276 | Tragic 95.1% |