Irish vs Trinidadian and Tobagonian Male Disability
COMPARE
Irish
Trinidadian and Tobagonian
Male Disability
Male Disability Comparison
Irish
Trinidadians and Tobagonians
12.7%
MALE DISABILITY
0.0/ 100
METRIC RATING
282nd/ 347
METRIC RANK
11.0%
MALE DISABILITY
83.3/ 100
METRIC RATING
135th/ 347
METRIC RANK
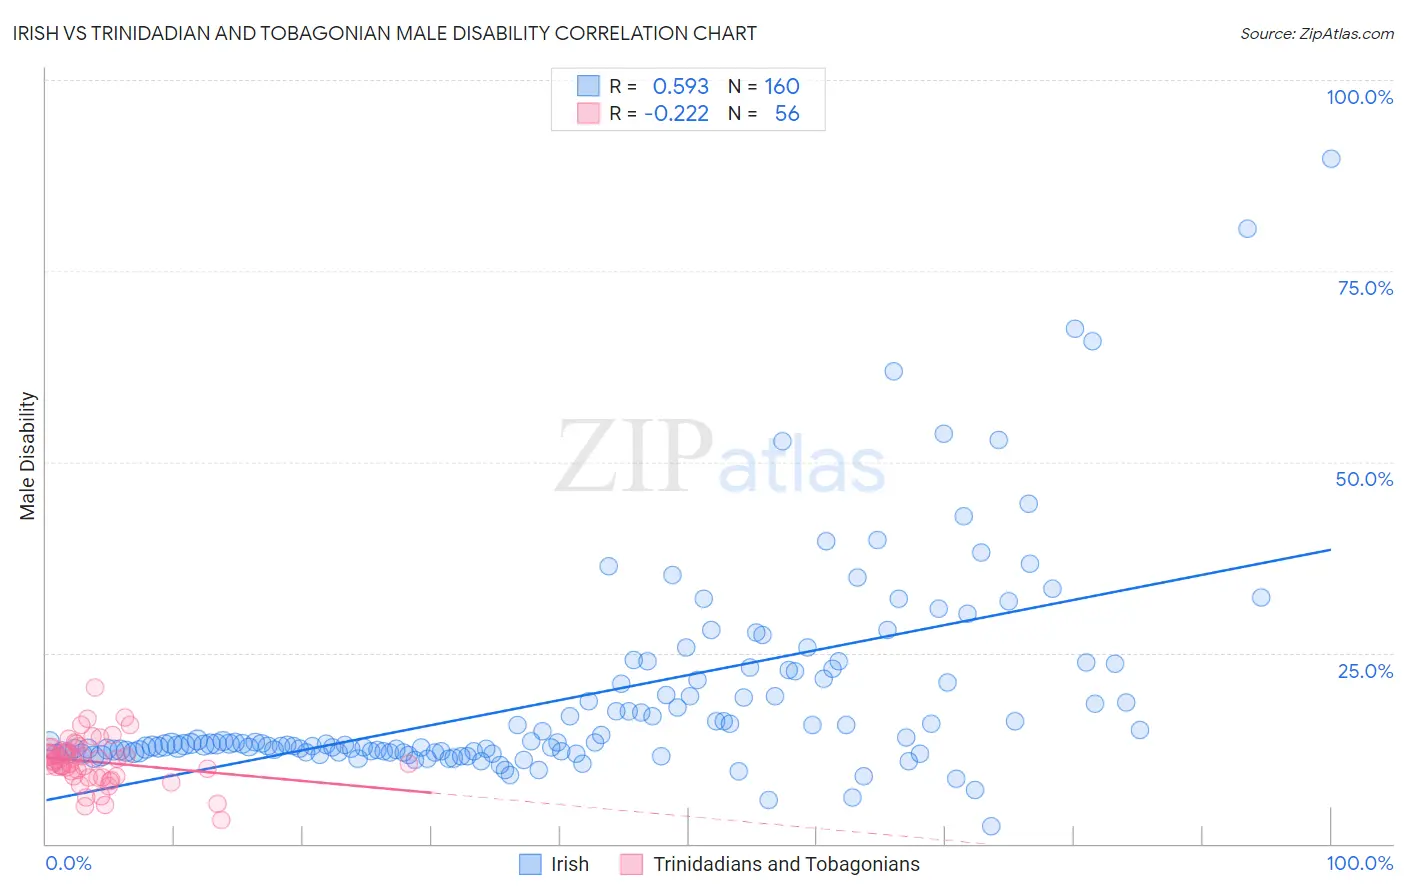
Irish vs Trinidadian and Tobagonian Male Disability Correlation Chart
The statistical analysis conducted on geographies consisting of 580,201,634 people shows a substantial positive correlation between the proportion of Irish and percentage of males with a disability in the United States with a correlation coefficient (R) of 0.593 and weighted average of 12.7%. Similarly, the statistical analysis conducted on geographies consisting of 219,818,350 people shows a weak negative correlation between the proportion of Trinidadians and Tobagonians and percentage of males with a disability in the United States with a correlation coefficient (R) of -0.222 and weighted average of 11.0%, a difference of 15.9%.
Male Disability Correlation Summary
| Measurement | Irish | Trinidadian and Tobagonian |
| Minimum | 2.4% | 3.1% |
| Maximum | 89.8% | 20.5% |
| Range | 87.4% | 17.4% |
| Mean | 19.1% | 10.7% |
| Median | 13.1% | 10.8% |
| Interquartile 25% (IQ1) | 12.0% | 8.8% |
| Interquartile 75% (IQ3) | 21.6% | 12.1% |
| Interquartile Range (IQR) | 9.5% | 3.3% |
| Standard Deviation (Sample) | 13.6% | 3.1% |
| Standard Deviation (Population) | 13.5% | 3.1% |
Similar Demographics by Male Disability
Demographics Similar to Irish by Male Disability
In terms of male disability, the demographic groups most similar to Irish are German (12.7%, a difference of 0.010%), Sioux (12.7%, a difference of 0.060%), Dutch (12.7%, a difference of 0.11%), Slovak (12.7%, a difference of 0.16%), and Spanish (12.7%, a difference of 0.28%).
| Demographics | Rating | Rank | Male Disability |
| Fijians | 0.0 /100 | #275 | Tragic 12.6% |
| Africans | 0.0 /100 | #276 | Tragic 12.6% |
| Finns | 0.0 /100 | #277 | Tragic 12.6% |
| Central American Indians | 0.0 /100 | #278 | Tragic 12.7% |
| Slovaks | 0.0 /100 | #279 | Tragic 12.7% |
| Dutch | 0.0 /100 | #280 | Tragic 12.7% |
| Sioux | 0.0 /100 | #281 | Tragic 12.7% |
| Irish | 0.0 /100 | #282 | Tragic 12.7% |
| Germans | 0.0 /100 | #283 | Tragic 12.7% |
| Spanish | 0.0 /100 | #284 | Tragic 12.7% |
| Welsh | 0.0 /100 | #285 | Tragic 12.7% |
| Scottish | 0.0 /100 | #286 | Tragic 12.8% |
| Cape Verdeans | 0.0 /100 | #287 | Tragic 12.8% |
| Yup'ik | 0.0 /100 | #288 | Tragic 12.8% |
| Immigrants | Cabo Verde | 0.0 /100 | #289 | Tragic 12.8% |
Demographics Similar to Trinidadians and Tobagonians by Male Disability
In terms of male disability, the demographic groups most similar to Trinidadians and Tobagonians are Bhutanese (11.0%, a difference of 0.010%), Immigrants from Costa Rica (11.0%, a difference of 0.040%), Ugandan (11.0%, a difference of 0.070%), Immigrants from Fiji (11.0%, a difference of 0.080%), and Macedonian (11.0%, a difference of 0.10%).
| Demographics | Rating | Rank | Male Disability |
| Immigrants | Latvia | 85.5 /100 | #128 | Excellent 10.9% |
| Immigrants | Philippines | 85.4 /100 | #129 | Excellent 10.9% |
| Brazilians | 85.4 /100 | #130 | Excellent 10.9% |
| Macedonians | 84.2 /100 | #131 | Excellent 11.0% |
| Immigrants | Fiji | 84.0 /100 | #132 | Excellent 11.0% |
| Ugandans | 83.9 /100 | #133 | Excellent 11.0% |
| Bhutanese | 83.4 /100 | #134 | Excellent 11.0% |
| Trinidadians and Tobagonians | 83.3 /100 | #135 | Excellent 11.0% |
| Immigrants | Costa Rica | 82.8 /100 | #136 | Excellent 11.0% |
| Immigrants | Europe | 82.0 /100 | #137 | Excellent 11.0% |
| Nigerians | 81.9 /100 | #138 | Excellent 11.0% |
| South Africans | 81.7 /100 | #139 | Excellent 11.0% |
| Immigrants | Italy | 81.5 /100 | #140 | Excellent 11.0% |
| Arabs | 81.5 /100 | #141 | Excellent 11.0% |
| Immigrants | Sudan | 81.5 /100 | #142 | Excellent 11.0% |