Hawaiian vs Immigrants from Saudi Arabia Male Disability
COMPARE
Hawaiian
Immigrants from Saudi Arabia
Male Disability
Male Disability Comparison
Hawaiians
Immigrants from Saudi Arabia
12.3%
MALE DISABILITY
0.1/ 100
METRIC RATING
266th/ 347
METRIC RANK
10.4%
MALE DISABILITY
99.6/ 100
METRIC RATING
52nd/ 347
METRIC RANK
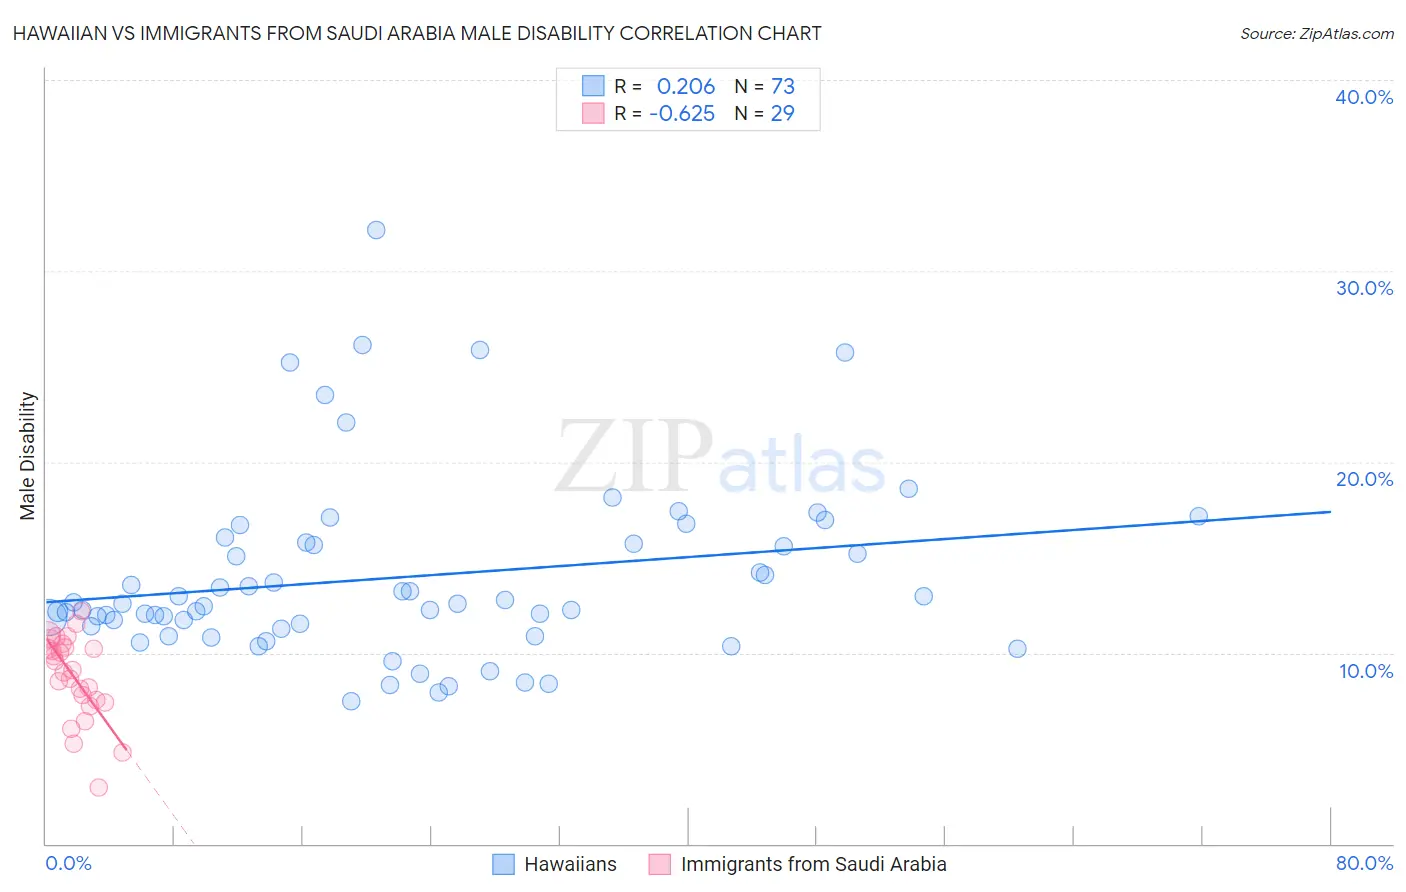
Hawaiian vs Immigrants from Saudi Arabia Male Disability Correlation Chart
The statistical analysis conducted on geographies consisting of 327,496,415 people shows a weak positive correlation between the proportion of Hawaiians and percentage of males with a disability in the United States with a correlation coefficient (R) of 0.206 and weighted average of 12.3%. Similarly, the statistical analysis conducted on geographies consisting of 164,290,331 people shows a significant negative correlation between the proportion of Immigrants from Saudi Arabia and percentage of males with a disability in the United States with a correlation coefficient (R) of -0.625 and weighted average of 10.4%, a difference of 18.3%.
Male Disability Correlation Summary
| Measurement | Hawaiian | Immigrants from Saudi Arabia |
| Minimum | 7.5% | 3.0% |
| Maximum | 32.2% | 12.2% |
| Range | 24.7% | 9.2% |
| Mean | 14.0% | 8.8% |
| Median | 12.6% | 9.1% |
| Interquartile 25% (IQ1) | 11.3% | 7.5% |
| Interquartile 75% (IQ3) | 15.7% | 10.4% |
| Interquartile Range (IQR) | 4.4% | 2.9% |
| Standard Deviation (Sample) | 4.7% | 2.2% |
| Standard Deviation (Population) | 4.7% | 2.1% |
Similar Demographics by Male Disability
Demographics Similar to Hawaiians by Male Disability
In terms of male disability, the demographic groups most similar to Hawaiians are Immigrants from Portugal (12.3%, a difference of 0.020%), Immigrants from Germany (12.3%, a difference of 0.050%), Portuguese (12.3%, a difference of 0.18%), Czechoslovakian (12.3%, a difference of 0.18%), and Spaniard (12.3%, a difference of 0.26%).
| Demographics | Rating | Rank | Male Disability |
| Belgians | 0.3 /100 | #259 | Tragic 12.1% |
| Swedes | 0.3 /100 | #260 | Tragic 12.1% |
| Slavs | 0.2 /100 | #261 | Tragic 12.2% |
| Norwegians | 0.2 /100 | #262 | Tragic 12.2% |
| Canadians | 0.2 /100 | #263 | Tragic 12.2% |
| Nepalese | 0.2 /100 | #264 | Tragic 12.2% |
| Immigrants | Portugal | 0.1 /100 | #265 | Tragic 12.3% |
| Hawaiians | 0.1 /100 | #266 | Tragic 12.3% |
| Immigrants | Germany | 0.1 /100 | #267 | Tragic 12.3% |
| Portuguese | 0.1 /100 | #268 | Tragic 12.3% |
| Czechoslovakians | 0.1 /100 | #269 | Tragic 12.3% |
| Spaniards | 0.1 /100 | #270 | Tragic 12.3% |
| Scandinavians | 0.1 /100 | #271 | Tragic 12.3% |
| Hmong | 0.0 /100 | #272 | Tragic 12.5% |
| Native Hawaiians | 0.0 /100 | #273 | Tragic 12.5% |
Demographics Similar to Immigrants from Saudi Arabia by Male Disability
In terms of male disability, the demographic groups most similar to Immigrants from Saudi Arabia are Salvadoran (10.4%, a difference of 0.020%), Immigrants from Uzbekistan (10.4%, a difference of 0.020%), Peruvian (10.4%, a difference of 0.060%), Immigrants from Eritrea (10.4%, a difference of 0.080%), and Tongan (10.4%, a difference of 0.12%).
| Demographics | Rating | Rank | Male Disability |
| Turks | 99.7 /100 | #45 | Exceptional 10.3% |
| Cambodians | 99.7 /100 | #46 | Exceptional 10.3% |
| Immigrants | Peru | 99.7 /100 | #47 | Exceptional 10.3% |
| Israelis | 99.7 /100 | #48 | Exceptional 10.3% |
| Immigrants | Spain | 99.7 /100 | #49 | Exceptional 10.3% |
| South Americans | 99.6 /100 | #50 | Exceptional 10.3% |
| Salvadorans | 99.6 /100 | #51 | Exceptional 10.4% |
| Immigrants | Saudi Arabia | 99.6 /100 | #52 | Exceptional 10.4% |
| Immigrants | Uzbekistan | 99.6 /100 | #53 | Exceptional 10.4% |
| Peruvians | 99.6 /100 | #54 | Exceptional 10.4% |
| Immigrants | Eritrea | 99.6 /100 | #55 | Exceptional 10.4% |
| Tongans | 99.6 /100 | #56 | Exceptional 10.4% |
| Immigrants | South America | 99.6 /100 | #57 | Exceptional 10.4% |
| Immigrants | Japan | 99.5 /100 | #58 | Exceptional 10.4% |
| Immigrants | Australia | 99.5 /100 | #59 | Exceptional 10.4% |