Immigrants from Romania vs Trinidadian and Tobagonian Male Disability
COMPARE
Immigrants from Romania
Trinidadian and Tobagonian
Male Disability
Male Disability Comparison
Immigrants from Romania
Trinidadians and Tobagonians
10.7%
MALE DISABILITY
96.5/ 100
METRIC RATING
98th/ 347
METRIC RANK
11.0%
MALE DISABILITY
83.3/ 100
METRIC RATING
135th/ 347
METRIC RANK
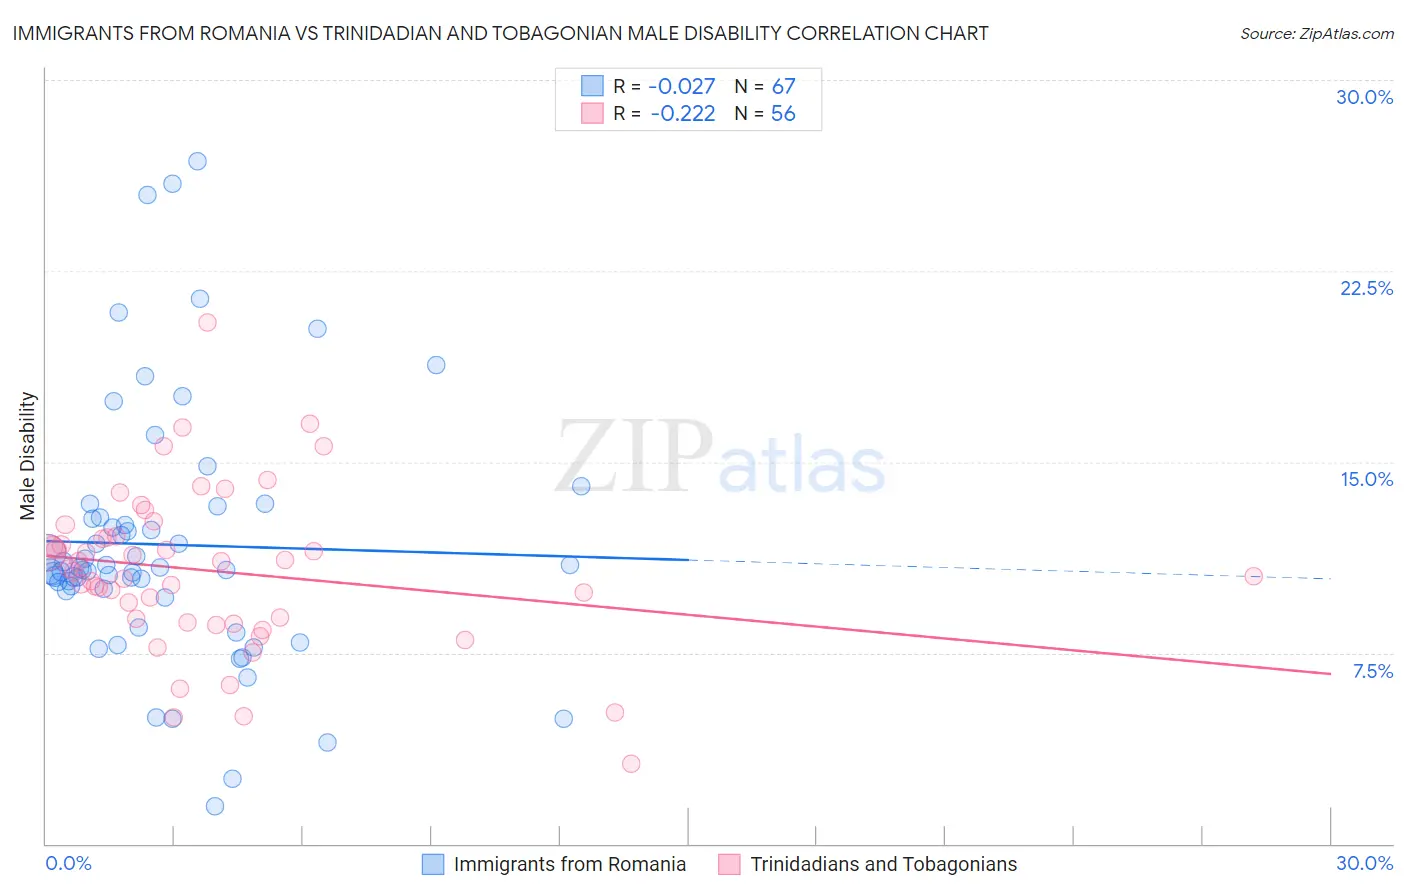
Immigrants from Romania vs Trinidadian and Tobagonian Male Disability Correlation Chart
The statistical analysis conducted on geographies consisting of 256,982,377 people shows no correlation between the proportion of Immigrants from Romania and percentage of males with a disability in the United States with a correlation coefficient (R) of -0.027 and weighted average of 10.7%. Similarly, the statistical analysis conducted on geographies consisting of 219,818,350 people shows a weak negative correlation between the proportion of Trinidadians and Tobagonians and percentage of males with a disability in the United States with a correlation coefficient (R) of -0.222 and weighted average of 11.0%, a difference of 2.5%.
Male Disability Correlation Summary
| Measurement | Immigrants from Romania | Trinidadian and Tobagonian |
| Minimum | 1.5% | 3.1% |
| Maximum | 26.8% | 20.5% |
| Range | 25.3% | 17.4% |
| Mean | 11.7% | 10.7% |
| Median | 10.7% | 10.8% |
| Interquartile 25% (IQ1) | 9.9% | 8.8% |
| Interquartile 75% (IQ3) | 12.8% | 12.1% |
| Interquartile Range (IQR) | 2.9% | 3.3% |
| Standard Deviation (Sample) | 5.0% | 3.1% |
| Standard Deviation (Population) | 5.0% | 3.1% |
Similar Demographics by Male Disability
Demographics Similar to Immigrants from Romania by Male Disability
In terms of male disability, the demographic groups most similar to Immigrants from Romania are Immigrants from Armenia (10.7%, a difference of 0.060%), Nicaraguan (10.7%, a difference of 0.080%), Immigrants from Switzerland (10.7%, a difference of 0.14%), Chilean (10.7%, a difference of 0.18%), and Immigrants from Sweden (10.7%, a difference of 0.21%).
| Demographics | Rating | Rank | Male Disability |
| Immigrants | France | 97.6 /100 | #91 | Exceptional 10.6% |
| Palestinians | 97.4 /100 | #92 | Exceptional 10.7% |
| Immigrants | St. Vincent and the Grenadines | 97.1 /100 | #93 | Exceptional 10.7% |
| Immigrants | Sweden | 96.9 /100 | #94 | Exceptional 10.7% |
| Chileans | 96.9 /100 | #95 | Exceptional 10.7% |
| Nicaraguans | 96.6 /100 | #96 | Exceptional 10.7% |
| Immigrants | Armenia | 96.6 /100 | #97 | Exceptional 10.7% |
| Immigrants | Romania | 96.5 /100 | #98 | Exceptional 10.7% |
| Immigrants | Switzerland | 96.1 /100 | #99 | Exceptional 10.7% |
| Immigrants | Kazakhstan | 95.9 /100 | #100 | Exceptional 10.7% |
| Immigrants | Greece | 95.6 /100 | #101 | Exceptional 10.7% |
| Immigrants | Eastern Europe | 95.3 /100 | #102 | Exceptional 10.7% |
| Uruguayans | 95.3 /100 | #103 | Exceptional 10.7% |
| Immigrants | Nigeria | 95.1 /100 | #104 | Exceptional 10.8% |
| Immigrants | Brazil | 95.0 /100 | #105 | Exceptional 10.8% |
Demographics Similar to Trinidadians and Tobagonians by Male Disability
In terms of male disability, the demographic groups most similar to Trinidadians and Tobagonians are Bhutanese (11.0%, a difference of 0.010%), Immigrants from Costa Rica (11.0%, a difference of 0.040%), Ugandan (11.0%, a difference of 0.070%), Immigrants from Fiji (11.0%, a difference of 0.080%), and Macedonian (11.0%, a difference of 0.10%).
| Demographics | Rating | Rank | Male Disability |
| Immigrants | Latvia | 85.5 /100 | #128 | Excellent 10.9% |
| Immigrants | Philippines | 85.4 /100 | #129 | Excellent 10.9% |
| Brazilians | 85.4 /100 | #130 | Excellent 10.9% |
| Macedonians | 84.2 /100 | #131 | Excellent 11.0% |
| Immigrants | Fiji | 84.0 /100 | #132 | Excellent 11.0% |
| Ugandans | 83.9 /100 | #133 | Excellent 11.0% |
| Bhutanese | 83.4 /100 | #134 | Excellent 11.0% |
| Trinidadians and Tobagonians | 83.3 /100 | #135 | Excellent 11.0% |
| Immigrants | Costa Rica | 82.8 /100 | #136 | Excellent 11.0% |
| Immigrants | Europe | 82.0 /100 | #137 | Excellent 11.0% |
| Nigerians | 81.9 /100 | #138 | Excellent 11.0% |
| South Africans | 81.7 /100 | #139 | Excellent 11.0% |
| Immigrants | Italy | 81.5 /100 | #140 | Excellent 11.0% |
| Arabs | 81.5 /100 | #141 | Excellent 11.0% |
| Immigrants | Sudan | 81.5 /100 | #142 | Excellent 11.0% |