Albanian vs Trinidadian and Tobagonian Male Disability
COMPARE
Albanian
Trinidadian and Tobagonian
Male Disability
Male Disability Comparison
Albanians
Trinidadians and Tobagonians
11.1%
MALE DISABILITY
66.5/ 100
METRIC RATING
160th/ 347
METRIC RANK
11.0%
MALE DISABILITY
83.3/ 100
METRIC RATING
135th/ 347
METRIC RANK
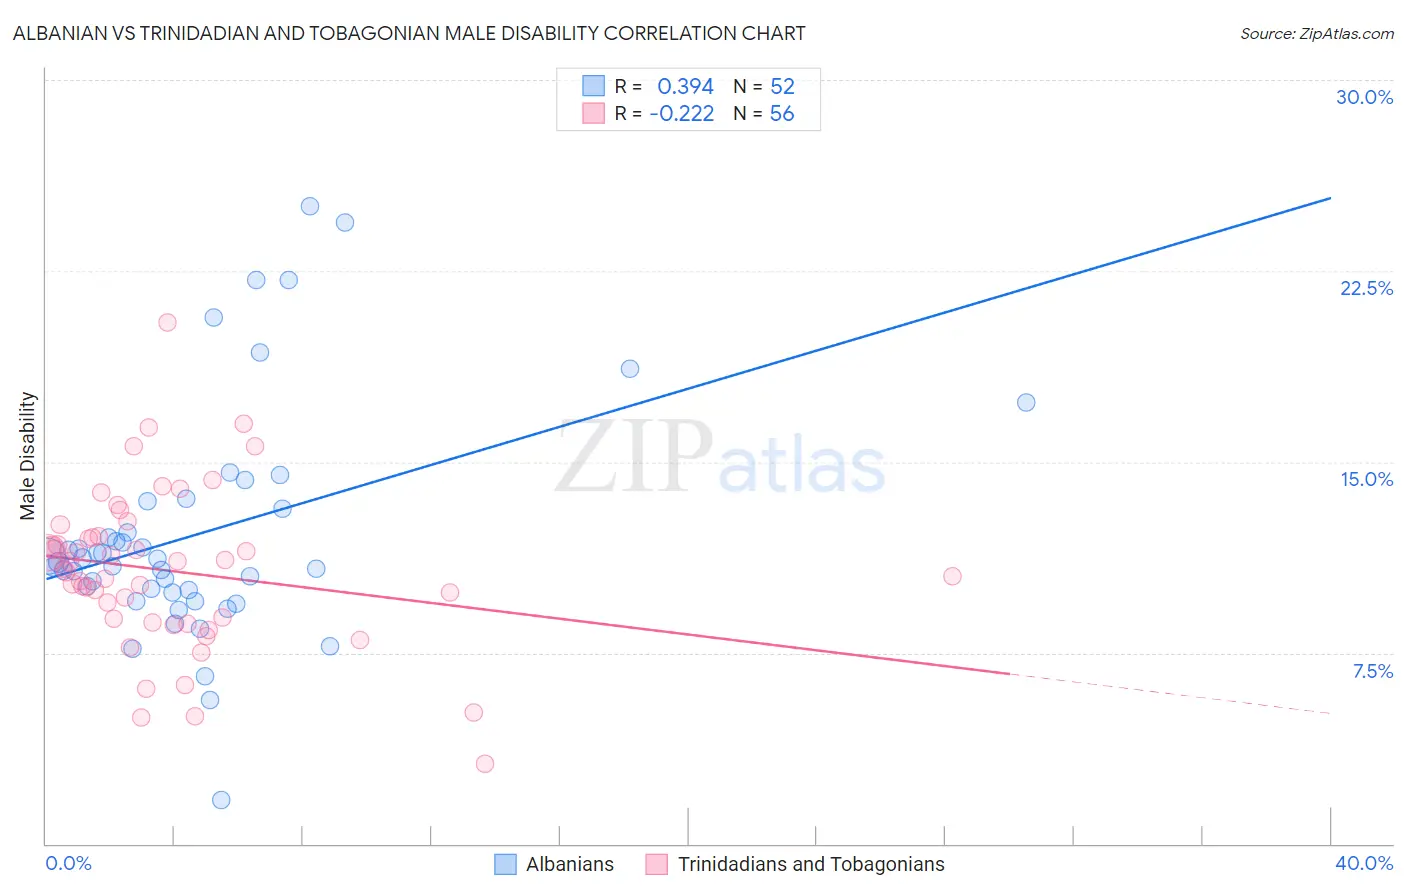
Albanian vs Trinidadian and Tobagonian Male Disability Correlation Chart
The statistical analysis conducted on geographies consisting of 193,257,433 people shows a mild positive correlation between the proportion of Albanians and percentage of males with a disability in the United States with a correlation coefficient (R) of 0.394 and weighted average of 11.1%. Similarly, the statistical analysis conducted on geographies consisting of 219,818,350 people shows a weak negative correlation between the proportion of Trinidadians and Tobagonians and percentage of males with a disability in the United States with a correlation coefficient (R) of -0.222 and weighted average of 11.0%, a difference of 1.3%.
Male Disability Correlation Summary
| Measurement | Albanian | Trinidadian and Tobagonian |
| Minimum | 1.7% | 3.1% |
| Maximum | 25.0% | 20.5% |
| Range | 23.3% | 17.4% |
| Mean | 12.2% | 10.7% |
| Median | 11.1% | 10.8% |
| Interquartile 25% (IQ1) | 9.9% | 8.8% |
| Interquartile 75% (IQ3) | 13.3% | 12.1% |
| Interquartile Range (IQR) | 3.4% | 3.3% |
| Standard Deviation (Sample) | 4.6% | 3.1% |
| Standard Deviation (Population) | 4.5% | 3.1% |
Similar Demographics by Male Disability
Demographics Similar to Albanians by Male Disability
In terms of male disability, the demographic groups most similar to Albanians are Guatemalan (11.1%, a difference of 0.040%), Immigrants from West Indies (11.1%, a difference of 0.050%), Immigrants from Haiti (11.1%, a difference of 0.070%), Latvian (11.1%, a difference of 0.11%), and Immigrants from Kenya (11.1%, a difference of 0.16%).
| Demographics | Rating | Rank | Male Disability |
| Immigrants | Northern Europe | 73.2 /100 | #153 | Good 11.1% |
| Immigrants | Moldova | 72.8 /100 | #154 | Good 11.1% |
| Immigrants | Middle Africa | 70.9 /100 | #155 | Good 11.1% |
| Russians | 69.8 /100 | #156 | Good 11.1% |
| Immigrants | Western Africa | 69.2 /100 | #157 | Good 11.1% |
| Latvians | 68.1 /100 | #158 | Good 11.1% |
| Guatemalans | 67.2 /100 | #159 | Good 11.1% |
| Albanians | 66.5 /100 | #160 | Good 11.1% |
| Immigrants | West Indies | 65.7 /100 | #161 | Good 11.1% |
| Immigrants | Haiti | 65.3 /100 | #162 | Good 11.1% |
| Immigrants | Kenya | 63.8 /100 | #163 | Good 11.1% |
| British West Indians | 62.8 /100 | #164 | Good 11.1% |
| Luxembourgers | 61.9 /100 | #165 | Good 11.1% |
| Immigrants | Hungary | 61.2 /100 | #166 | Good 11.1% |
| Immigrants | Southern Europe | 54.4 /100 | #167 | Average 11.2% |
Demographics Similar to Trinidadians and Tobagonians by Male Disability
In terms of male disability, the demographic groups most similar to Trinidadians and Tobagonians are Bhutanese (11.0%, a difference of 0.010%), Immigrants from Costa Rica (11.0%, a difference of 0.040%), Ugandan (11.0%, a difference of 0.070%), Immigrants from Fiji (11.0%, a difference of 0.080%), and Macedonian (11.0%, a difference of 0.10%).
| Demographics | Rating | Rank | Male Disability |
| Immigrants | Latvia | 85.5 /100 | #128 | Excellent 10.9% |
| Immigrants | Philippines | 85.4 /100 | #129 | Excellent 10.9% |
| Brazilians | 85.4 /100 | #130 | Excellent 10.9% |
| Macedonians | 84.2 /100 | #131 | Excellent 11.0% |
| Immigrants | Fiji | 84.0 /100 | #132 | Excellent 11.0% |
| Ugandans | 83.9 /100 | #133 | Excellent 11.0% |
| Bhutanese | 83.4 /100 | #134 | Excellent 11.0% |
| Trinidadians and Tobagonians | 83.3 /100 | #135 | Excellent 11.0% |
| Immigrants | Costa Rica | 82.8 /100 | #136 | Excellent 11.0% |
| Immigrants | Europe | 82.0 /100 | #137 | Excellent 11.0% |
| Nigerians | 81.9 /100 | #138 | Excellent 11.0% |
| South Africans | 81.7 /100 | #139 | Excellent 11.0% |
| Immigrants | Italy | 81.5 /100 | #140 | Excellent 11.0% |
| Arabs | 81.5 /100 | #141 | Excellent 11.0% |
| Immigrants | Sudan | 81.5 /100 | #142 | Excellent 11.0% |