Hawaiian vs French Canadian Male Disability
COMPARE
Hawaiian
French Canadian
Male Disability
Male Disability Comparison
Hawaiians
French Canadians
12.3%
MALE DISABILITY
0.1/ 100
METRIC RATING
266th/ 347
METRIC RANK
13.3%
MALE DISABILITY
0.0/ 100
METRIC RATING
305th/ 347
METRIC RANK
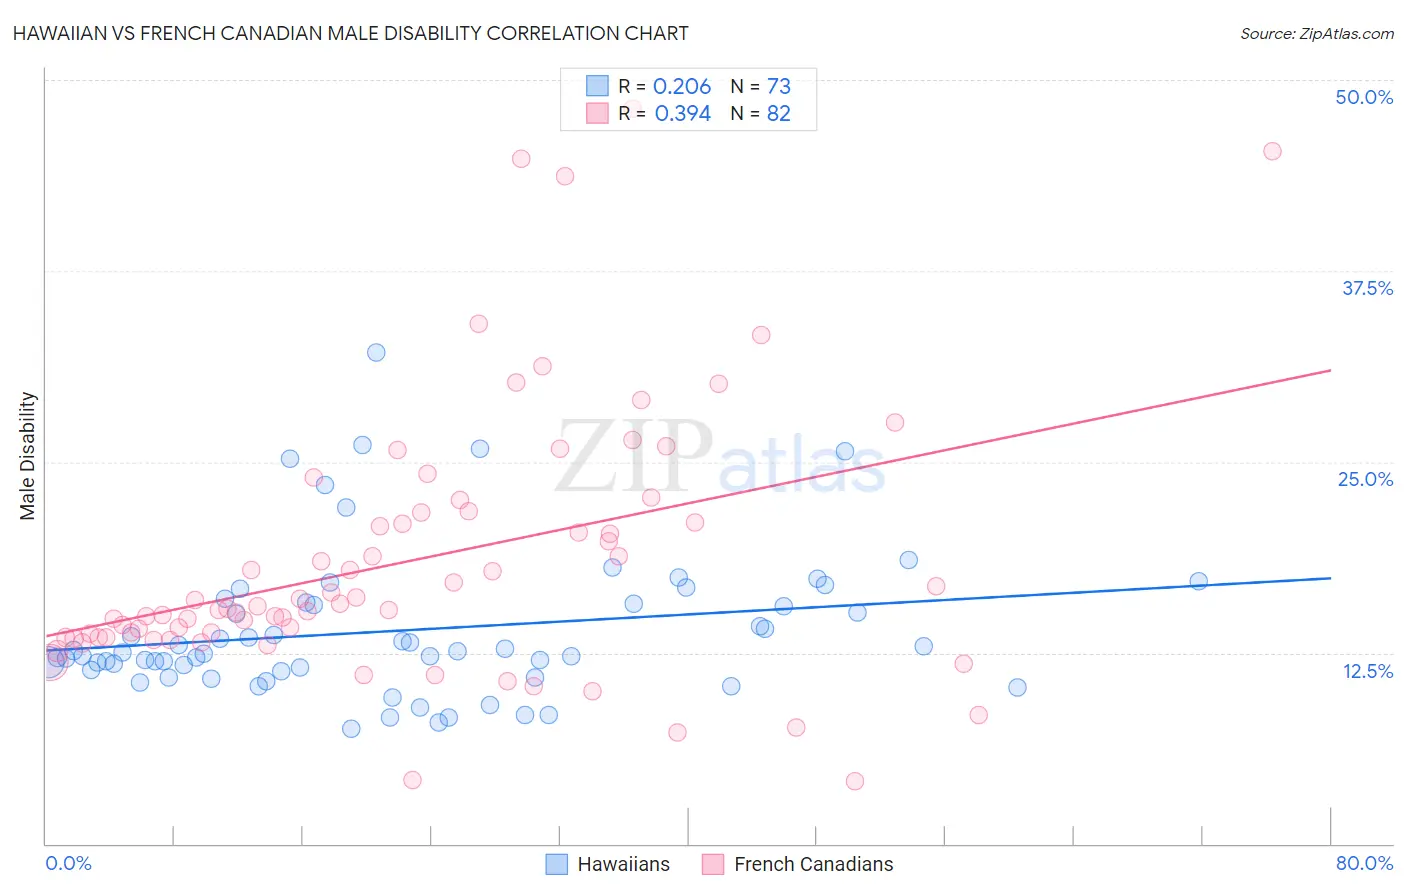
Hawaiian vs French Canadian Male Disability Correlation Chart
The statistical analysis conducted on geographies consisting of 327,496,415 people shows a weak positive correlation between the proportion of Hawaiians and percentage of males with a disability in the United States with a correlation coefficient (R) of 0.206 and weighted average of 12.3%. Similarly, the statistical analysis conducted on geographies consisting of 502,511,439 people shows a mild positive correlation between the proportion of French Canadians and percentage of males with a disability in the United States with a correlation coefficient (R) of 0.394 and weighted average of 13.3%, a difference of 8.3%.
Male Disability Correlation Summary
| Measurement | Hawaiian | French Canadian |
| Minimum | 7.5% | 4.1% |
| Maximum | 32.2% | 48.1% |
| Range | 24.7% | 44.0% |
| Mean | 14.0% | 18.5% |
| Median | 12.6% | 15.5% |
| Interquartile 25% (IQ1) | 11.3% | 13.5% |
| Interquartile 75% (IQ3) | 15.7% | 21.7% |
| Interquartile Range (IQR) | 4.4% | 8.2% |
| Standard Deviation (Sample) | 4.7% | 8.7% |
| Standard Deviation (Population) | 4.7% | 8.7% |
Similar Demographics by Male Disability
Demographics Similar to Hawaiians by Male Disability
In terms of male disability, the demographic groups most similar to Hawaiians are Immigrants from Portugal (12.3%, a difference of 0.020%), Immigrants from Germany (12.3%, a difference of 0.050%), Portuguese (12.3%, a difference of 0.18%), Czechoslovakian (12.3%, a difference of 0.18%), and Spaniard (12.3%, a difference of 0.26%).
| Demographics | Rating | Rank | Male Disability |
| Belgians | 0.3 /100 | #259 | Tragic 12.1% |
| Swedes | 0.3 /100 | #260 | Tragic 12.1% |
| Slavs | 0.2 /100 | #261 | Tragic 12.2% |
| Norwegians | 0.2 /100 | #262 | Tragic 12.2% |
| Canadians | 0.2 /100 | #263 | Tragic 12.2% |
| Nepalese | 0.2 /100 | #264 | Tragic 12.2% |
| Immigrants | Portugal | 0.1 /100 | #265 | Tragic 12.3% |
| Hawaiians | 0.1 /100 | #266 | Tragic 12.3% |
| Immigrants | Germany | 0.1 /100 | #267 | Tragic 12.3% |
| Portuguese | 0.1 /100 | #268 | Tragic 12.3% |
| Czechoslovakians | 0.1 /100 | #269 | Tragic 12.3% |
| Spaniards | 0.1 /100 | #270 | Tragic 12.3% |
| Scandinavians | 0.1 /100 | #271 | Tragic 12.3% |
| Hmong | 0.0 /100 | #272 | Tragic 12.5% |
| Native Hawaiians | 0.0 /100 | #273 | Tragic 12.5% |
Demographics Similar to French Canadians by Male Disability
In terms of male disability, the demographic groups most similar to French Canadians are Spanish American (13.3%, a difference of 0.20%), Black/African American (13.2%, a difference of 0.41%), Arapaho (13.3%, a difference of 0.42%), French American Indian (13.4%, a difference of 0.58%), and Scotch-Irish (13.2%, a difference of 0.74%).
| Demographics | Rating | Rank | Male Disability |
| Pennsylvania Germans | 0.0 /100 | #298 | Tragic 13.0% |
| Celtics | 0.0 /100 | #299 | Tragic 13.0% |
| Cheyenne | 0.0 /100 | #300 | Tragic 13.0% |
| French | 0.0 /100 | #301 | Tragic 13.0% |
| Crow | 0.0 /100 | #302 | Tragic 13.1% |
| Scotch-Irish | 0.0 /100 | #303 | Tragic 13.2% |
| Blacks/African Americans | 0.0 /100 | #304 | Tragic 13.2% |
| French Canadians | 0.0 /100 | #305 | Tragic 13.3% |
| Spanish Americans | 0.0 /100 | #306 | Tragic 13.3% |
| Arapaho | 0.0 /100 | #307 | Tragic 13.3% |
| French American Indians | 0.0 /100 | #308 | Tragic 13.4% |
| Blackfeet | 0.0 /100 | #309 | Tragic 13.4% |
| Immigrants | Azores | 0.0 /100 | #310 | Tragic 13.4% |
| Delaware | 0.0 /100 | #311 | Tragic 13.5% |
| Yakama | 0.0 /100 | #312 | Tragic 13.5% |