Hawaiian vs Bulgarian Male Disability
COMPARE
Hawaiian
Bulgarian
Male Disability
Male Disability Comparison
Hawaiians
Bulgarians
12.3%
MALE DISABILITY
0.1/ 100
METRIC RATING
266th/ 347
METRIC RANK
10.6%
MALE DISABILITY
98.1/ 100
METRIC RATING
84th/ 347
METRIC RANK
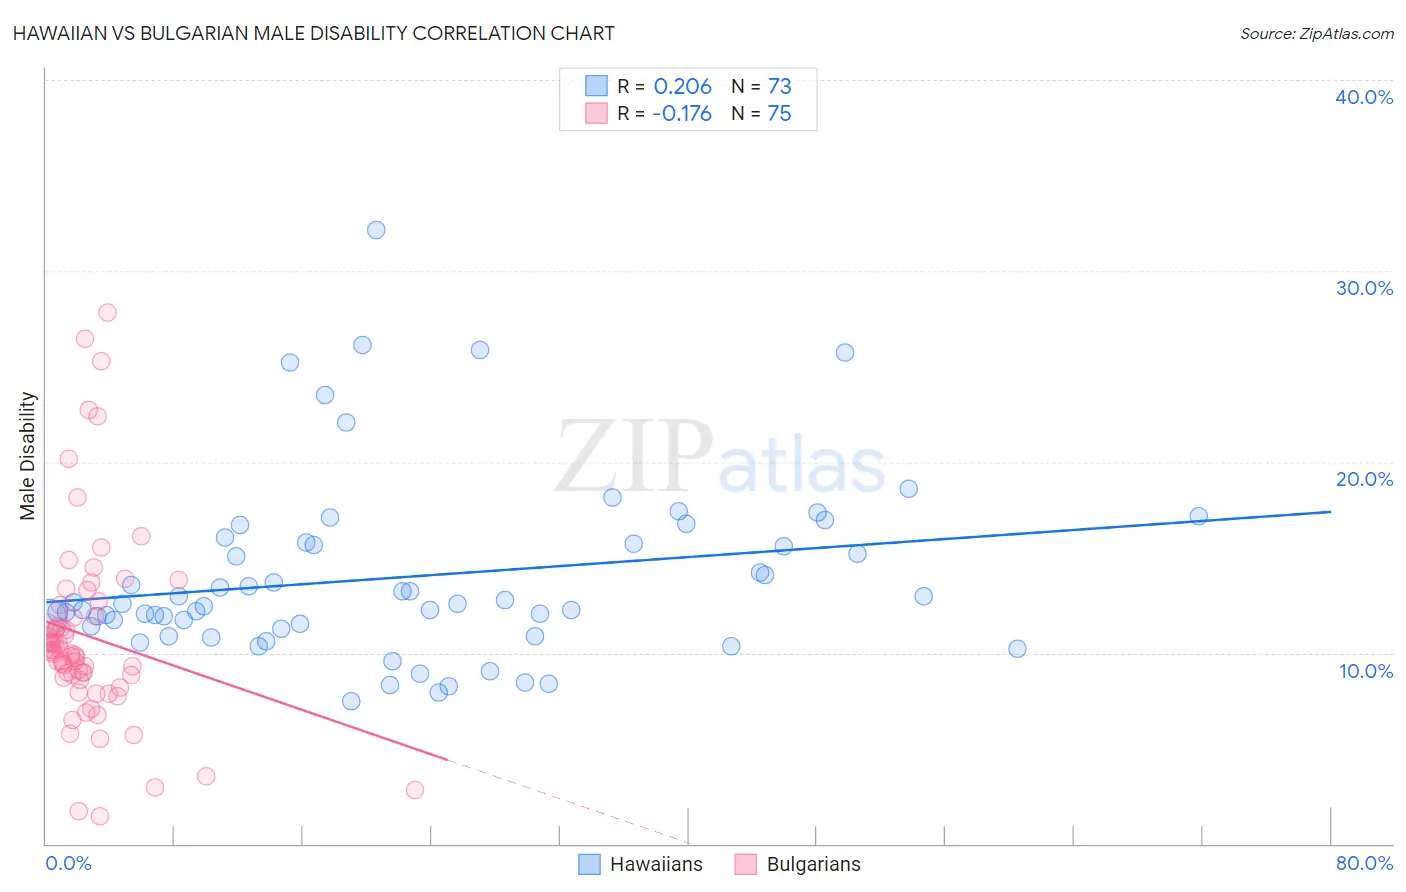
Hawaiian vs Bulgarian Male Disability Correlation Chart
The statistical analysis conducted on geographies consisting of 327,496,415 people shows a weak positive correlation between the proportion of Hawaiians and percentage of males with a disability in the United States with a correlation coefficient (R) of 0.206 and weighted average of 12.3%. Similarly, the statistical analysis conducted on geographies consisting of 205,628,995 people shows a poor negative correlation between the proportion of Bulgarians and percentage of males with a disability in the United States with a correlation coefficient (R) of -0.176 and weighted average of 10.6%, a difference of 15.7%.
Male Disability Correlation Summary
| Measurement | Hawaiian | Bulgarian |
| Minimum | 7.5% | 1.5% |
| Maximum | 32.2% | 27.8% |
| Range | 24.7% | 26.4% |
| Mean | 14.0% | 10.9% |
| Median | 12.6% | 10.0% |
| Interquartile 25% (IQ1) | 11.3% | 8.7% |
| Interquartile 75% (IQ3) | 15.7% | 11.9% |
| Interquartile Range (IQR) | 4.4% | 3.2% |
| Standard Deviation (Sample) | 4.7% | 5.0% |
| Standard Deviation (Population) | 4.7% | 5.0% |
Similar Demographics by Male Disability
Demographics Similar to Hawaiians by Male Disability
In terms of male disability, the demographic groups most similar to Hawaiians are Immigrants from Portugal (12.3%, a difference of 0.020%), Immigrants from Germany (12.3%, a difference of 0.050%), Portuguese (12.3%, a difference of 0.18%), Czechoslovakian (12.3%, a difference of 0.18%), and Spaniard (12.3%, a difference of 0.26%).
| Demographics | Rating | Rank | Male Disability |
| Belgians | 0.3 /100 | #259 | Tragic 12.1% |
| Swedes | 0.3 /100 | #260 | Tragic 12.1% |
| Slavs | 0.2 /100 | #261 | Tragic 12.2% |
| Norwegians | 0.2 /100 | #262 | Tragic 12.2% |
| Canadians | 0.2 /100 | #263 | Tragic 12.2% |
| Nepalese | 0.2 /100 | #264 | Tragic 12.2% |
| Immigrants | Portugal | 0.1 /100 | #265 | Tragic 12.3% |
| Hawaiians | 0.1 /100 | #266 | Tragic 12.3% |
| Immigrants | Germany | 0.1 /100 | #267 | Tragic 12.3% |
| Portuguese | 0.1 /100 | #268 | Tragic 12.3% |
| Czechoslovakians | 0.1 /100 | #269 | Tragic 12.3% |
| Spaniards | 0.1 /100 | #270 | Tragic 12.3% |
| Scandinavians | 0.1 /100 | #271 | Tragic 12.3% |
| Hmong | 0.0 /100 | #272 | Tragic 12.5% |
| Native Hawaiians | 0.0 /100 | #273 | Tragic 12.5% |
Demographics Similar to Bulgarians by Male Disability
In terms of male disability, the demographic groups most similar to Bulgarians are Immigrants from Poland (10.6%, a difference of 0.010%), Immigrants from Guyana (10.6%, a difference of 0.080%), Immigrants from Chile (10.6%, a difference of 0.14%), Sri Lankan (10.6%, a difference of 0.18%), and Immigrants from Ireland (10.6%, a difference of 0.18%).
| Demographics | Rating | Rank | Male Disability |
| Laotians | 98.6 /100 | #77 | Exceptional 10.6% |
| Immigrants | Russia | 98.6 /100 | #78 | Exceptional 10.6% |
| Zimbabweans | 98.4 /100 | #79 | Exceptional 10.6% |
| Immigrants | Jordan | 98.4 /100 | #80 | Exceptional 10.6% |
| Immigrants | Chile | 98.3 /100 | #81 | Exceptional 10.6% |
| Immigrants | Guyana | 98.2 /100 | #82 | Exceptional 10.6% |
| Immigrants | Poland | 98.1 /100 | #83 | Exceptional 10.6% |
| Bulgarians | 98.1 /100 | #84 | Exceptional 10.6% |
| Sri Lankans | 97.9 /100 | #85 | Exceptional 10.6% |
| Immigrants | Ireland | 97.9 /100 | #86 | Exceptional 10.6% |
| Immigrants | Vietnam | 97.9 /100 | #87 | Exceptional 10.6% |
| Immigrants | Western Asia | 97.8 /100 | #88 | Exceptional 10.6% |
| Immigrants | Nicaragua | 97.8 /100 | #89 | Exceptional 10.6% |
| Immigrants | Morocco | 97.7 /100 | #90 | Exceptional 10.6% |
| Immigrants | France | 97.6 /100 | #91 | Exceptional 10.6% |