Yugoslavian vs Trinidadian and Tobagonian Male Disability
COMPARE
Yugoslavian
Trinidadian and Tobagonian
Male Disability
Male Disability Comparison
Yugoslavians
Trinidadians and Tobagonians
11.9%
MALE DISABILITY
1.2/ 100
METRIC RATING
238th/ 347
METRIC RANK
11.0%
MALE DISABILITY
83.3/ 100
METRIC RATING
135th/ 347
METRIC RANK
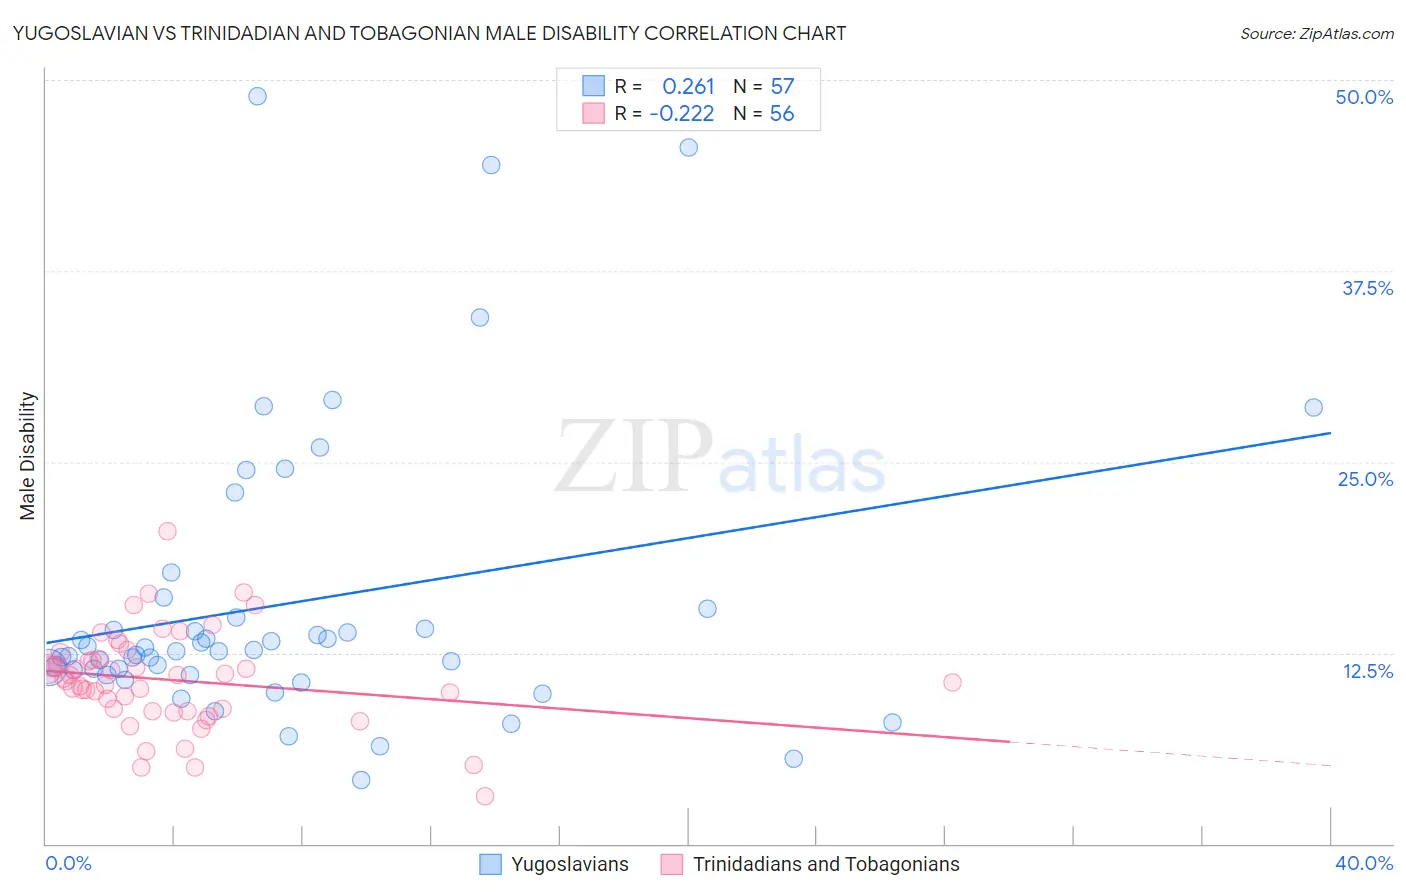
Yugoslavian vs Trinidadian and Tobagonian Male Disability Correlation Chart
The statistical analysis conducted on geographies consisting of 285,684,891 people shows a weak positive correlation between the proportion of Yugoslavians and percentage of males with a disability in the United States with a correlation coefficient (R) of 0.261 and weighted average of 11.9%. Similarly, the statistical analysis conducted on geographies consisting of 219,818,350 people shows a weak negative correlation between the proportion of Trinidadians and Tobagonians and percentage of males with a disability in the United States with a correlation coefficient (R) of -0.222 and weighted average of 11.0%, a difference of 8.5%.
Male Disability Correlation Summary
| Measurement | Yugoslavian | Trinidadian and Tobagonian |
| Minimum | 4.2% | 3.1% |
| Maximum | 48.9% | 20.5% |
| Range | 44.8% | 17.4% |
| Mean | 15.7% | 10.7% |
| Median | 12.6% | 10.8% |
| Interquartile 25% (IQ1) | 11.2% | 8.8% |
| Interquartile 75% (IQ3) | 15.1% | 12.1% |
| Interquartile Range (IQR) | 3.9% | 3.3% |
| Standard Deviation (Sample) | 9.5% | 3.1% |
| Standard Deviation (Population) | 9.4% | 3.1% |
Similar Demographics by Male Disability
Demographics Similar to Yugoslavians by Male Disability
In terms of male disability, the demographic groups most similar to Yugoslavians are Italian (11.9%, a difference of 0.050%), Carpatho Rusyn (11.9%, a difference of 0.10%), Czech (11.9%, a difference of 0.10%), U.S. Virgin Islander (11.9%, a difference of 0.11%), and Bahamian (11.9%, a difference of 0.14%).
| Demographics | Rating | Rank | Male Disability |
| Dominicans | 1.8 /100 | #231 | Tragic 11.8% |
| Malaysians | 1.8 /100 | #232 | Tragic 11.8% |
| Mexicans | 1.7 /100 | #233 | Tragic 11.8% |
| Immigrants | Canada | 1.6 /100 | #234 | Tragic 11.9% |
| Immigrants | North America | 1.5 /100 | #235 | Tragic 11.9% |
| U.S. Virgin Islanders | 1.3 /100 | #236 | Tragic 11.9% |
| Carpatho Rusyns | 1.3 /100 | #237 | Tragic 11.9% |
| Yugoslavians | 1.2 /100 | #238 | Tragic 11.9% |
| Italians | 1.2 /100 | #239 | Tragic 11.9% |
| Czechs | 1.1 /100 | #240 | Tragic 11.9% |
| Bahamians | 1.1 /100 | #241 | Tragic 11.9% |
| Northern Europeans | 1.1 /100 | #242 | Tragic 11.9% |
| Samoans | 1.1 /100 | #243 | Tragic 11.9% |
| Immigrants | Laos | 1.0 /100 | #244 | Tragic 11.9% |
| Immigrants | Liberia | 1.0 /100 | #245 | Tragic 11.9% |
Demographics Similar to Trinidadians and Tobagonians by Male Disability
In terms of male disability, the demographic groups most similar to Trinidadians and Tobagonians are Bhutanese (11.0%, a difference of 0.010%), Immigrants from Costa Rica (11.0%, a difference of 0.040%), Ugandan (11.0%, a difference of 0.070%), Immigrants from Fiji (11.0%, a difference of 0.080%), and Macedonian (11.0%, a difference of 0.10%).
| Demographics | Rating | Rank | Male Disability |
| Immigrants | Latvia | 85.5 /100 | #128 | Excellent 10.9% |
| Immigrants | Philippines | 85.4 /100 | #129 | Excellent 10.9% |
| Brazilians | 85.4 /100 | #130 | Excellent 10.9% |
| Macedonians | 84.2 /100 | #131 | Excellent 11.0% |
| Immigrants | Fiji | 84.0 /100 | #132 | Excellent 11.0% |
| Ugandans | 83.9 /100 | #133 | Excellent 11.0% |
| Bhutanese | 83.4 /100 | #134 | Excellent 11.0% |
| Trinidadians and Tobagonians | 83.3 /100 | #135 | Excellent 11.0% |
| Immigrants | Costa Rica | 82.8 /100 | #136 | Excellent 11.0% |
| Immigrants | Europe | 82.0 /100 | #137 | Excellent 11.0% |
| Nigerians | 81.9 /100 | #138 | Excellent 11.0% |
| South Africans | 81.7 /100 | #139 | Excellent 11.0% |
| Immigrants | Italy | 81.5 /100 | #140 | Excellent 11.0% |
| Arabs | 81.5 /100 | #141 | Excellent 11.0% |
| Immigrants | Sudan | 81.5 /100 | #142 | Excellent 11.0% |