Immigrants from Barbados vs Trinidadian and Tobagonian Male Disability
COMPARE
Immigrants from Barbados
Trinidadian and Tobagonian
Male Disability
Male Disability Comparison
Immigrants from Barbados
Trinidadians and Tobagonians
10.8%
MALE DISABILITY
92.2/ 100
METRIC RATING
115th/ 347
METRIC RANK
11.0%
MALE DISABILITY
83.3/ 100
METRIC RATING
135th/ 347
METRIC RANK
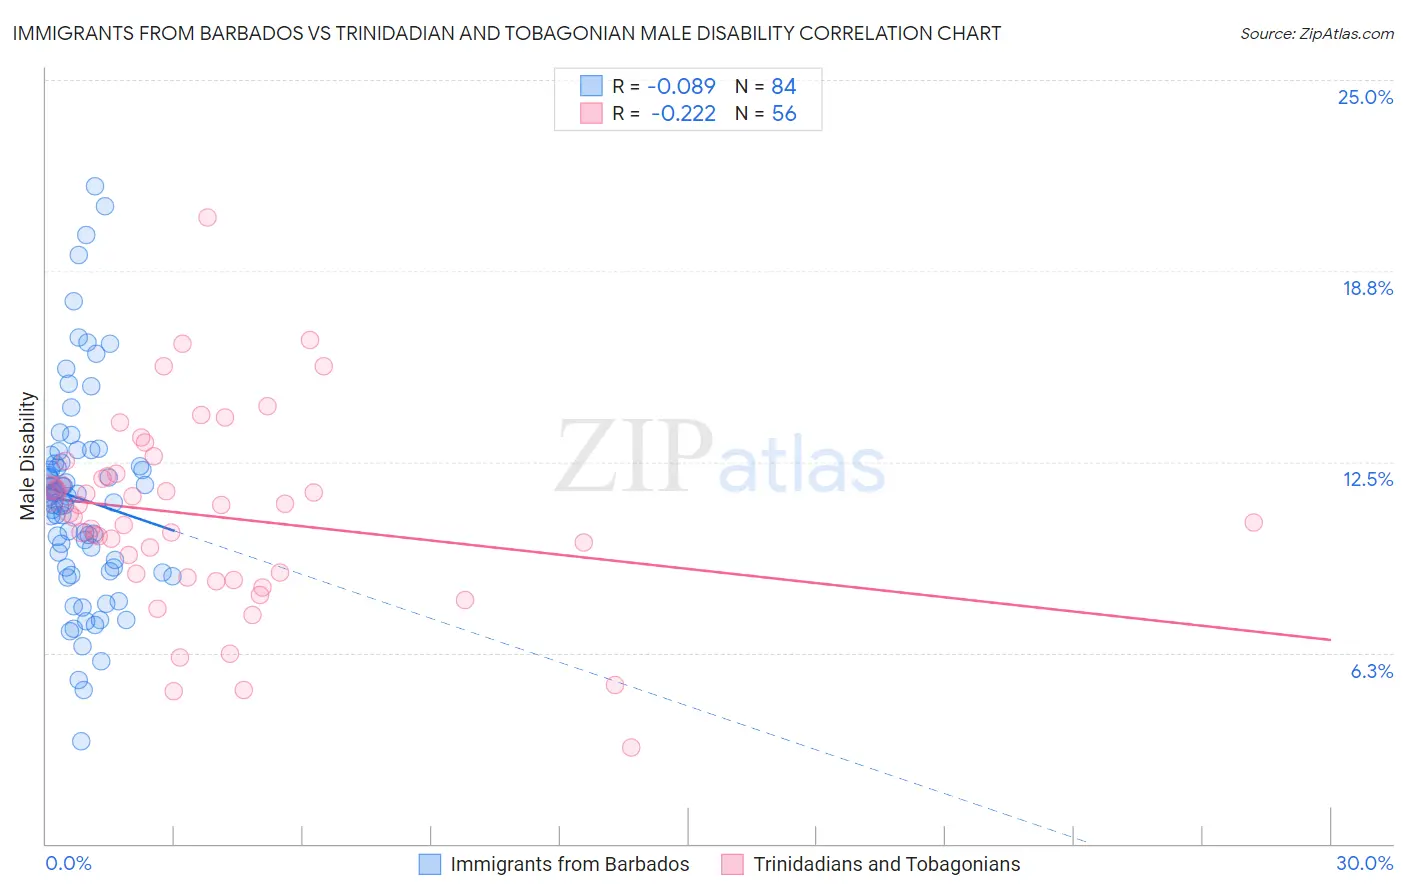
Immigrants from Barbados vs Trinidadian and Tobagonian Male Disability Correlation Chart
The statistical analysis conducted on geographies consisting of 112,772,632 people shows a slight negative correlation between the proportion of Immigrants from Barbados and percentage of males with a disability in the United States with a correlation coefficient (R) of -0.089 and weighted average of 10.8%. Similarly, the statistical analysis conducted on geographies consisting of 219,818,350 people shows a weak negative correlation between the proportion of Trinidadians and Tobagonians and percentage of males with a disability in the United States with a correlation coefficient (R) of -0.222 and weighted average of 11.0%, a difference of 1.2%.
Male Disability Correlation Summary
| Measurement | Immigrants from Barbados | Trinidadian and Tobagonian |
| Minimum | 3.3% | 3.1% |
| Maximum | 21.5% | 20.5% |
| Range | 18.2% | 17.4% |
| Mean | 11.3% | 10.7% |
| Median | 11.4% | 10.8% |
| Interquartile 25% (IQ1) | 9.1% | 8.8% |
| Interquartile 75% (IQ3) | 12.5% | 12.1% |
| Interquartile Range (IQR) | 3.4% | 3.3% |
| Standard Deviation (Sample) | 3.4% | 3.1% |
| Standard Deviation (Population) | 3.4% | 3.1% |
Demographics Similar to Immigrants from Barbados and Trinidadians and Tobagonians by Male Disability
In terms of male disability, the demographic groups most similar to Immigrants from Barbados are Immigrants from South Africa (10.8%, a difference of 0.080%), Eastern European (10.9%, a difference of 0.29%), Immigrants from Cuba (10.9%, a difference of 0.36%), Armenian (10.9%, a difference of 0.37%), and Immigrants from Africa (10.9%, a difference of 0.48%). Similarly, the demographic groups most similar to Trinidadians and Tobagonians are Bhutanese (11.0%, a difference of 0.010%), Ugandan (11.0%, a difference of 0.070%), Immigrants from Fiji (11.0%, a difference of 0.080%), Macedonian (11.0%, a difference of 0.10%), and Immigrants from Latvia (10.9%, a difference of 0.24%).
| Demographics | Rating | Rank | Male Disability |
| Immigrants | Barbados | 92.2 /100 | #115 | Exceptional 10.8% |
| Immigrants | South Africa | 91.8 /100 | #116 | Exceptional 10.8% |
| Eastern Europeans | 90.6 /100 | #117 | Exceptional 10.9% |
| Immigrants | Cuba | 90.2 /100 | #118 | Exceptional 10.9% |
| Armenians | 90.1 /100 | #119 | Exceptional 10.9% |
| Immigrants | Africa | 89.4 /100 | #120 | Excellent 10.9% |
| Immigrants | South Eastern Asia | 89.2 /100 | #121 | Excellent 10.9% |
| Immigrants | Ghana | 89.0 /100 | #122 | Excellent 10.9% |
| Immigrants | Czechoslovakia | 88.4 /100 | #123 | Excellent 10.9% |
| South American Indians | 88.1 /100 | #124 | Excellent 10.9% |
| Immigrants | North Macedonia | 88.1 /100 | #125 | Excellent 10.9% |
| Immigrants | Trinidad and Tobago | 86.9 /100 | #126 | Excellent 10.9% |
| Immigrants | Ukraine | 86.8 /100 | #127 | Excellent 10.9% |
| Immigrants | Latvia | 85.5 /100 | #128 | Excellent 10.9% |
| Immigrants | Philippines | 85.4 /100 | #129 | Excellent 10.9% |
| Brazilians | 85.4 /100 | #130 | Excellent 10.9% |
| Macedonians | 84.2 /100 | #131 | Excellent 11.0% |
| Immigrants | Fiji | 84.0 /100 | #132 | Excellent 11.0% |
| Ugandans | 83.9 /100 | #133 | Excellent 11.0% |
| Bhutanese | 83.4 /100 | #134 | Excellent 11.0% |
| Trinidadians and Tobagonians | 83.3 /100 | #135 | Excellent 11.0% |