Hawaiian vs Immigrants from Central America Male Disability
COMPARE
Hawaiian
Immigrants from Central America
Male Disability
Male Disability Comparison
Hawaiians
Immigrants from Central America
12.3%
MALE DISABILITY
0.1/ 100
METRIC RATING
266th/ 347
METRIC RANK
11.3%
MALE DISABILITY
32.9/ 100
METRIC RATING
183rd/ 347
METRIC RANK
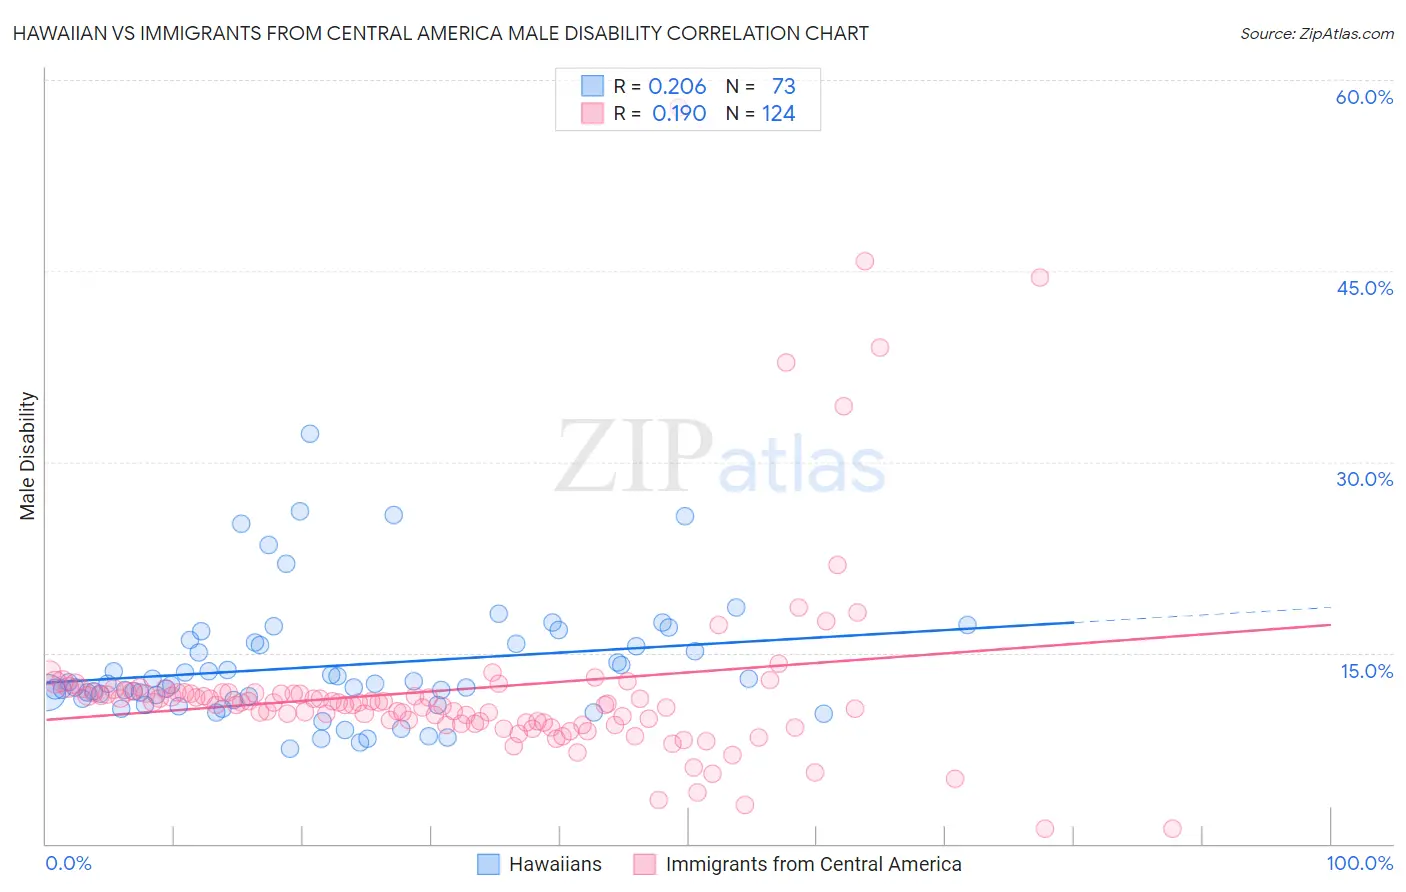
Hawaiian vs Immigrants from Central America Male Disability Correlation Chart
The statistical analysis conducted on geographies consisting of 327,496,415 people shows a weak positive correlation between the proportion of Hawaiians and percentage of males with a disability in the United States with a correlation coefficient (R) of 0.206 and weighted average of 12.3%. Similarly, the statistical analysis conducted on geographies consisting of 536,294,553 people shows a poor positive correlation between the proportion of Immigrants from Central America and percentage of males with a disability in the United States with a correlation coefficient (R) of 0.190 and weighted average of 11.3%, a difference of 8.3%.
Male Disability Correlation Summary
| Measurement | Hawaiian | Immigrants from Central America |
| Minimum | 7.5% | 1.2% |
| Maximum | 32.2% | 57.8% |
| Range | 24.7% | 56.6% |
| Mean | 14.0% | 12.1% |
| Median | 12.6% | 11.1% |
| Interquartile 25% (IQ1) | 11.3% | 9.5% |
| Interquartile 75% (IQ3) | 15.7% | 11.9% |
| Interquartile Range (IQR) | 4.4% | 2.4% |
| Standard Deviation (Sample) | 4.7% | 7.8% |
| Standard Deviation (Population) | 4.7% | 7.7% |
Similar Demographics by Male Disability
Demographics Similar to Hawaiians by Male Disability
In terms of male disability, the demographic groups most similar to Hawaiians are Immigrants from Portugal (12.3%, a difference of 0.020%), Immigrants from Germany (12.3%, a difference of 0.050%), Portuguese (12.3%, a difference of 0.18%), Czechoslovakian (12.3%, a difference of 0.18%), and Spaniard (12.3%, a difference of 0.26%).
| Demographics | Rating | Rank | Male Disability |
| Belgians | 0.3 /100 | #259 | Tragic 12.1% |
| Swedes | 0.3 /100 | #260 | Tragic 12.1% |
| Slavs | 0.2 /100 | #261 | Tragic 12.2% |
| Norwegians | 0.2 /100 | #262 | Tragic 12.2% |
| Canadians | 0.2 /100 | #263 | Tragic 12.2% |
| Nepalese | 0.2 /100 | #264 | Tragic 12.2% |
| Immigrants | Portugal | 0.1 /100 | #265 | Tragic 12.3% |
| Hawaiians | 0.1 /100 | #266 | Tragic 12.3% |
| Immigrants | Germany | 0.1 /100 | #267 | Tragic 12.3% |
| Portuguese | 0.1 /100 | #268 | Tragic 12.3% |
| Czechoslovakians | 0.1 /100 | #269 | Tragic 12.3% |
| Spaniards | 0.1 /100 | #270 | Tragic 12.3% |
| Scandinavians | 0.1 /100 | #271 | Tragic 12.3% |
| Hmong | 0.0 /100 | #272 | Tragic 12.5% |
| Native Hawaiians | 0.0 /100 | #273 | Tragic 12.5% |
Demographics Similar to Immigrants from Central America by Male Disability
In terms of male disability, the demographic groups most similar to Immigrants from Central America are Immigrants from Belize (11.3%, a difference of 0.050%), Immigrants from Senegal (11.3%, a difference of 0.090%), Iraqi (11.3%, a difference of 0.15%), Pakistani (11.3%, a difference of 0.16%), and Immigrants from Zaire (11.4%, a difference of 0.34%).
| Demographics | Rating | Rank | Male Disability |
| Syrians | 46.6 /100 | #176 | Average 11.2% |
| Immigrants | Norway | 44.2 /100 | #177 | Average 11.3% |
| Australians | 42.2 /100 | #178 | Average 11.3% |
| Immigrants | Caribbean | 41.4 /100 | #179 | Average 11.3% |
| Hondurans | 41.1 /100 | #180 | Average 11.3% |
| Immigrants | Senegal | 34.4 /100 | #181 | Fair 11.3% |
| Immigrants | Belize | 33.7 /100 | #182 | Fair 11.3% |
| Immigrants | Central America | 32.9 /100 | #183 | Fair 11.3% |
| Iraqis | 30.5 /100 | #184 | Fair 11.3% |
| Pakistanis | 30.3 /100 | #185 | Fair 11.3% |
| Immigrants | Zaire | 27.6 /100 | #186 | Fair 11.4% |
| Immigrants | Austria | 27.3 /100 | #187 | Fair 11.4% |
| Estonians | 26.8 /100 | #188 | Fair 11.4% |
| Immigrants | Netherlands | 25.9 /100 | #189 | Fair 11.4% |
| Immigrants | Bosnia and Herzegovina | 25.4 /100 | #190 | Fair 11.4% |