Guamanian/Chamorro vs Immigrants from Denmark Disability Age 35 to 64
COMPARE
Guamanian/Chamorro
Immigrants from Denmark
Disability Age 35 to 64
Disability Age 35 to 64 Comparison
Guamanians/Chamorros
Immigrants from Denmark
12.2%
DISABILITY AGE 35 TO 64
1.4/ 100
METRIC RATING
246th/ 347
METRIC RANK
10.3%
DISABILITY AGE 35 TO 64
98.4/ 100
METRIC RATING
97th/ 347
METRIC RANK
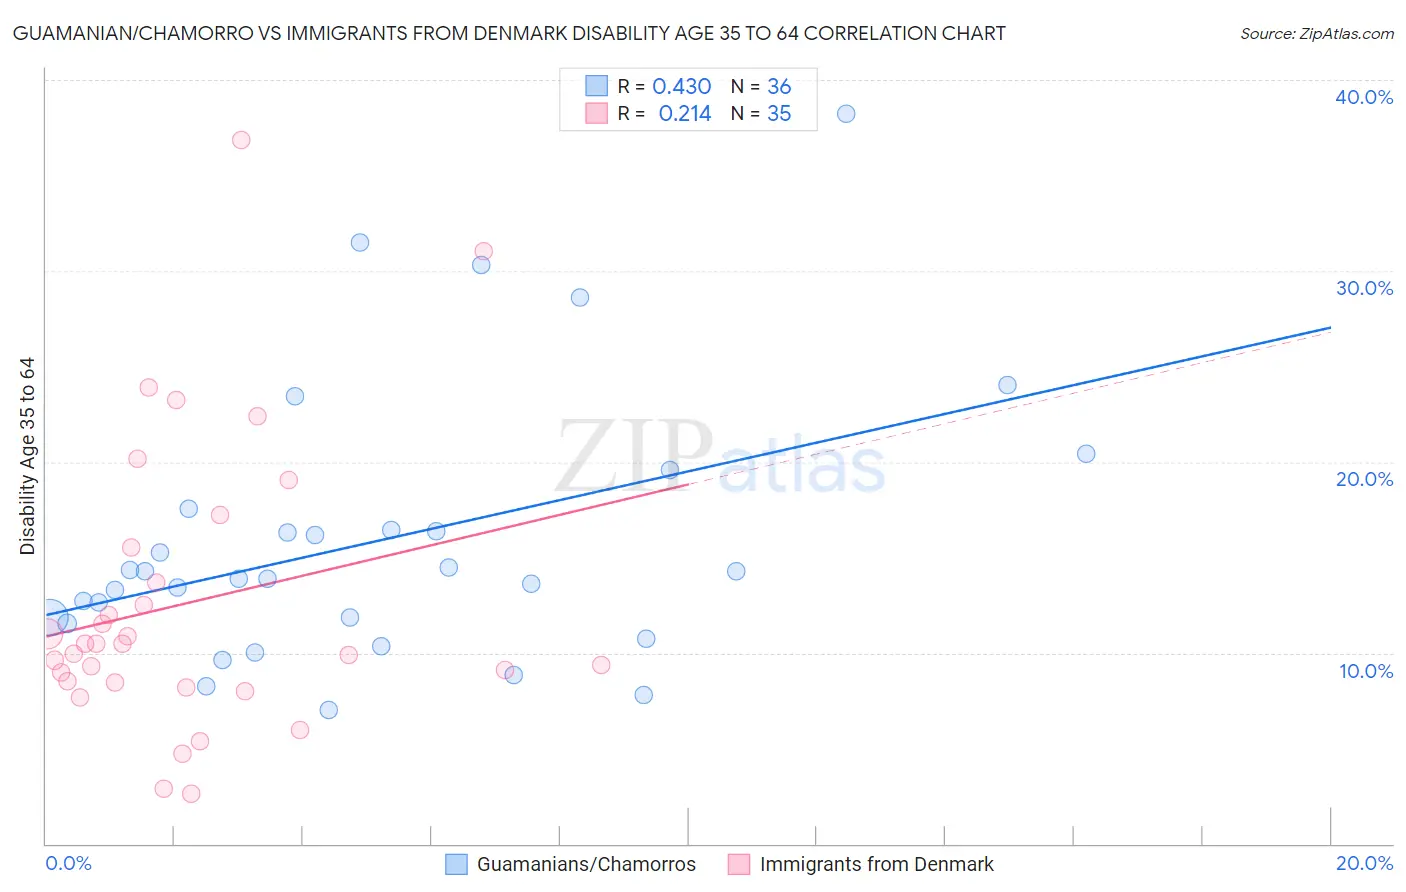
Guamanian/Chamorro vs Immigrants from Denmark Disability Age 35 to 64 Correlation Chart
The statistical analysis conducted on geographies consisting of 221,858,951 people shows a moderate positive correlation between the proportion of Guamanians/Chamorros and percentage of population with a disability between the ages 34 and 64 in the United States with a correlation coefficient (R) of 0.430 and weighted average of 12.2%. Similarly, the statistical analysis conducted on geographies consisting of 136,399,162 people shows a weak positive correlation between the proportion of Immigrants from Denmark and percentage of population with a disability between the ages 34 and 64 in the United States with a correlation coefficient (R) of 0.214 and weighted average of 10.3%, a difference of 18.4%.
Disability Age 35 to 64 Correlation Summary
| Measurement | Guamanian/Chamorro | Immigrants from Denmark |
| Minimum | 7.0% | 2.6% |
| Maximum | 38.2% | 36.8% |
| Range | 31.2% | 34.2% |
| Mean | 15.9% | 12.6% |
| Median | 14.1% | 10.5% |
| Interquartile 25% (IQ1) | 11.7% | 8.4% |
| Interquartile 75% (IQ3) | 17.0% | 15.5% |
| Interquartile Range (IQR) | 5.3% | 7.1% |
| Standard Deviation (Sample) | 7.1% | 7.5% |
| Standard Deviation (Population) | 7.0% | 7.4% |
Similar Demographics by Disability Age 35 to 64
Demographics Similar to Guamanians/Chamorros by Disability Age 35 to 64
In terms of disability age 35 to 64, the demographic groups most similar to Guamanians/Chamorros are Immigrants from Senegal (12.2%, a difference of 0.040%), Spaniard (12.3%, a difference of 0.13%), Hispanic or Latino (12.3%, a difference of 0.16%), Immigrants from Burma/Myanmar (12.3%, a difference of 0.29%), and German (12.3%, a difference of 0.37%).
| Demographics | Rating | Rank | Disability Age 35 to 64 |
| Immigrants | Western Africa | 3.3 /100 | #239 | Tragic 12.0% |
| Immigrants | Thailand | 3.3 /100 | #240 | Tragic 12.0% |
| Mexican American Indians | 3.2 /100 | #241 | Tragic 12.0% |
| Samoans | 2.8 /100 | #242 | Tragic 12.1% |
| Slovaks | 2.7 /100 | #243 | Tragic 12.1% |
| Finns | 2.3 /100 | #244 | Tragic 12.1% |
| Immigrants | Mexico | 2.2 /100 | #245 | Tragic 12.1% |
| Guamanians/Chamorros | 1.4 /100 | #246 | Tragic 12.2% |
| Immigrants | Senegal | 1.3 /100 | #247 | Tragic 12.2% |
| Spaniards | 1.3 /100 | #248 | Tragic 12.3% |
| Hispanics or Latinos | 1.3 /100 | #249 | Tragic 12.3% |
| Immigrants | Burma/Myanmar | 1.2 /100 | #250 | Tragic 12.3% |
| Germans | 1.1 /100 | #251 | Tragic 12.3% |
| Irish | 1.0 /100 | #252 | Tragic 12.3% |
| Dutch | 1.0 /100 | #253 | Tragic 12.3% |
Demographics Similar to Immigrants from Denmark by Disability Age 35 to 64
In terms of disability age 35 to 64, the demographic groups most similar to Immigrants from Denmark are Immigrants from Uruguay (10.3%, a difference of 0.070%), Immigrants from South Africa (10.3%, a difference of 0.18%), Palestinian (10.4%, a difference of 0.20%), Immigrants from Italy (10.3%, a difference of 0.42%), and Chinese (10.3%, a difference of 0.42%).
| Demographics | Rating | Rank | Disability Age 35 to 64 |
| Afghans | 98.9 /100 | #90 | Exceptional 10.3% |
| Immigrants | Lebanon | 98.9 /100 | #91 | Exceptional 10.3% |
| Immigrants | Northern Africa | 98.7 /100 | #92 | Exceptional 10.3% |
| Immigrants | North Macedonia | 98.7 /100 | #93 | Exceptional 10.3% |
| Immigrants | Italy | 98.7 /100 | #94 | Exceptional 10.3% |
| Chinese | 98.7 /100 | #95 | Exceptional 10.3% |
| Immigrants | South Africa | 98.5 /100 | #96 | Exceptional 10.3% |
| Immigrants | Denmark | 98.4 /100 | #97 | Exceptional 10.3% |
| Immigrants | Uruguay | 98.3 /100 | #98 | Exceptional 10.3% |
| Palestinians | 98.2 /100 | #99 | Exceptional 10.4% |
| Immigrants | Jordan | 98.1 /100 | #100 | Exceptional 10.4% |
| Immigrants | Philippines | 98.0 /100 | #101 | Exceptional 10.4% |
| Immigrants | Western Asia | 98.0 /100 | #102 | Exceptional 10.4% |
| Immigrants | Ukraine | 97.9 /100 | #103 | Exceptional 10.4% |
| Immigrants | Austria | 97.8 /100 | #104 | Exceptional 10.4% |