Guamanian/Chamorro vs Alsatian Disability Age 35 to 64
COMPARE
Guamanian/Chamorro
Alsatian
Disability Age 35 to 64
Disability Age 35 to 64 Comparison
Guamanians/Chamorros
Alsatians
12.2%
DISABILITY AGE 35 TO 64
1.4/ 100
METRIC RATING
246th/ 347
METRIC RANK
11.8%
DISABILITY AGE 35 TO 64
8.5/ 100
METRIC RATING
221st/ 347
METRIC RANK
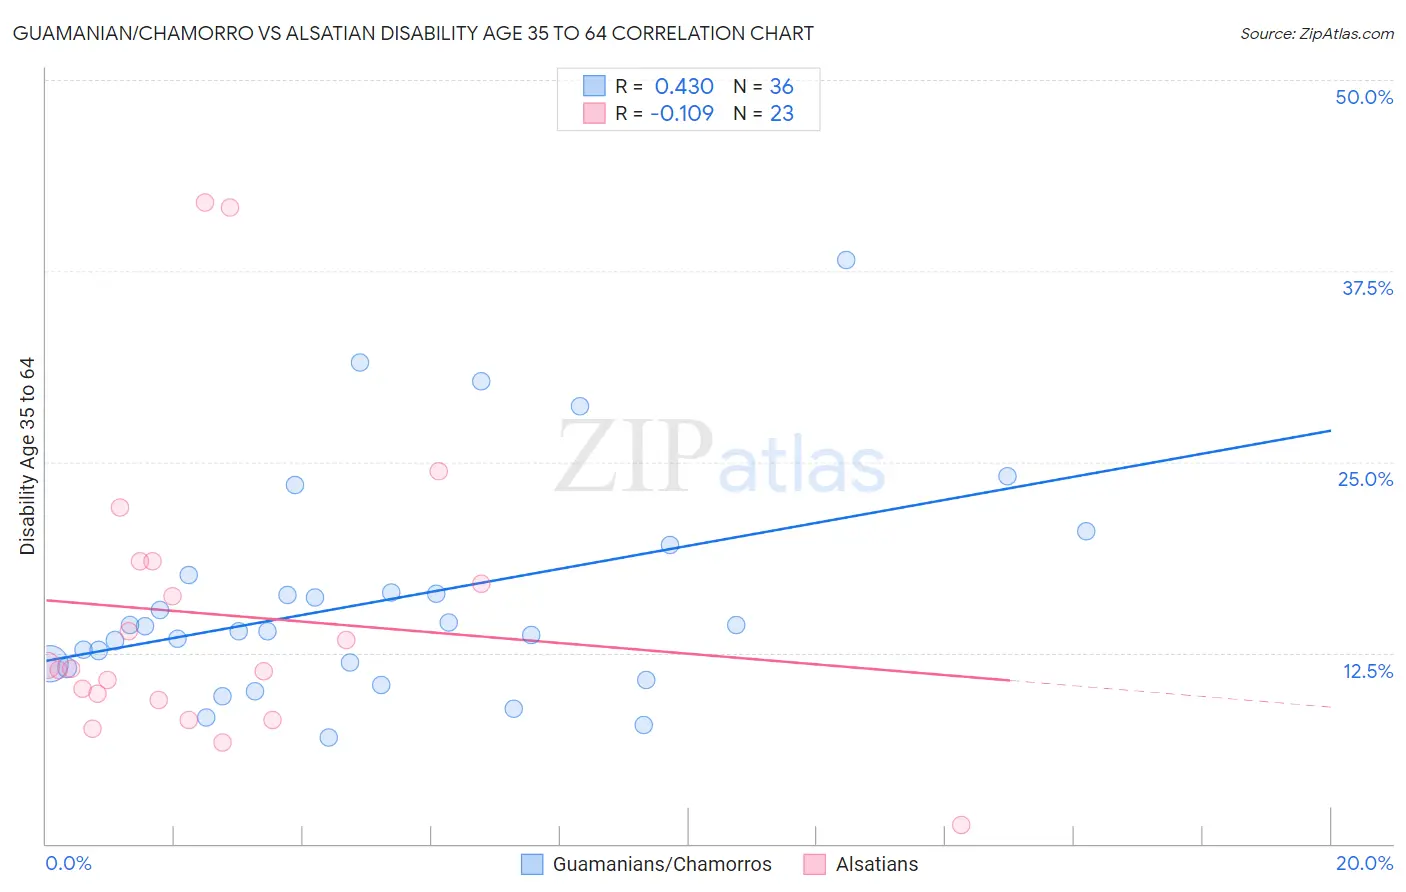
Guamanian/Chamorro vs Alsatian Disability Age 35 to 64 Correlation Chart
The statistical analysis conducted on geographies consisting of 221,858,951 people shows a moderate positive correlation between the proportion of Guamanians/Chamorros and percentage of population with a disability between the ages 34 and 64 in the United States with a correlation coefficient (R) of 0.430 and weighted average of 12.2%. Similarly, the statistical analysis conducted on geographies consisting of 82,678,494 people shows a poor negative correlation between the proportion of Alsatians and percentage of population with a disability between the ages 34 and 64 in the United States with a correlation coefficient (R) of -0.109 and weighted average of 11.8%, a difference of 3.6%.
Disability Age 35 to 64 Correlation Summary
| Measurement | Guamanian/Chamorro | Alsatian |
| Minimum | 7.0% | 1.2% |
| Maximum | 38.2% | 42.0% |
| Range | 31.2% | 40.8% |
| Mean | 15.9% | 15.0% |
| Median | 14.1% | 11.4% |
| Interquartile 25% (IQ1) | 11.7% | 9.4% |
| Interquartile 75% (IQ3) | 17.0% | 18.5% |
| Interquartile Range (IQR) | 5.3% | 9.1% |
| Standard Deviation (Sample) | 7.1% | 9.9% |
| Standard Deviation (Population) | 7.0% | 9.7% |
Similar Demographics by Disability Age 35 to 64
Demographics Similar to Guamanians/Chamorros by Disability Age 35 to 64
In terms of disability age 35 to 64, the demographic groups most similar to Guamanians/Chamorros are Immigrants from Senegal (12.2%, a difference of 0.040%), Spaniard (12.3%, a difference of 0.13%), Hispanic or Latino (12.3%, a difference of 0.16%), Immigrants from Burma/Myanmar (12.3%, a difference of 0.29%), and German (12.3%, a difference of 0.37%).
| Demographics | Rating | Rank | Disability Age 35 to 64 |
| Immigrants | Western Africa | 3.3 /100 | #239 | Tragic 12.0% |
| Immigrants | Thailand | 3.3 /100 | #240 | Tragic 12.0% |
| Mexican American Indians | 3.2 /100 | #241 | Tragic 12.0% |
| Samoans | 2.8 /100 | #242 | Tragic 12.1% |
| Slovaks | 2.7 /100 | #243 | Tragic 12.1% |
| Finns | 2.3 /100 | #244 | Tragic 12.1% |
| Immigrants | Mexico | 2.2 /100 | #245 | Tragic 12.1% |
| Guamanians/Chamorros | 1.4 /100 | #246 | Tragic 12.2% |
| Immigrants | Senegal | 1.3 /100 | #247 | Tragic 12.2% |
| Spaniards | 1.3 /100 | #248 | Tragic 12.3% |
| Hispanics or Latinos | 1.3 /100 | #249 | Tragic 12.3% |
| Immigrants | Burma/Myanmar | 1.2 /100 | #250 | Tragic 12.3% |
| Germans | 1.1 /100 | #251 | Tragic 12.3% |
| Irish | 1.0 /100 | #252 | Tragic 12.3% |
| Dutch | 1.0 /100 | #253 | Tragic 12.3% |
Demographics Similar to Alsatians by Disability Age 35 to 64
In terms of disability age 35 to 64, the demographic groups most similar to Alsatians are Honduran (11.8%, a difference of 0.020%), Immigrants from Honduras (11.8%, a difference of 0.020%), Immigrants from West Indies (11.8%, a difference of 0.090%), Czechoslovakian (11.8%, a difference of 0.13%), and Immigrants from Ghana (11.8%, a difference of 0.17%).
| Demographics | Rating | Rank | Disability Age 35 to 64 |
| Immigrants | Sudan | 11.4 /100 | #214 | Poor 11.7% |
| Spanish American Indians | 11.1 /100 | #215 | Poor 11.7% |
| Bahamians | 10.7 /100 | #216 | Poor 11.8% |
| Barbadians | 9.5 /100 | #217 | Tragic 11.8% |
| Immigrants | Bahamas | 9.2 /100 | #218 | Tragic 11.8% |
| Czechoslovakians | 9.0 /100 | #219 | Tragic 11.8% |
| Immigrants | West Indies | 8.9 /100 | #220 | Tragic 11.8% |
| Alsatians | 8.5 /100 | #221 | Tragic 11.8% |
| Hondurans | 8.4 /100 | #222 | Tragic 11.8% |
| Immigrants | Honduras | 8.4 /100 | #223 | Tragic 11.8% |
| Immigrants | Ghana | 7.8 /100 | #224 | Tragic 11.8% |
| Immigrants | Belize | 6.6 /100 | #225 | Tragic 11.9% |
| Scandinavians | 6.4 /100 | #226 | Tragic 11.9% |
| Immigrants | Central America | 6.3 /100 | #227 | Tragic 11.9% |
| Immigrants | Germany | 6.2 /100 | #228 | Tragic 11.9% |