Guamanian/Chamorro vs Shoshone Disability Age 35 to 64
COMPARE
Guamanian/Chamorro
Shoshone
Disability Age 35 to 64
Disability Age 35 to 64 Comparison
Guamanians/Chamorros
Shoshone
12.2%
DISABILITY AGE 35 TO 64
1.4/ 100
METRIC RATING
246th/ 347
METRIC RANK
14.5%
DISABILITY AGE 35 TO 64
0.0/ 100
METRIC RATING
314th/ 347
METRIC RANK
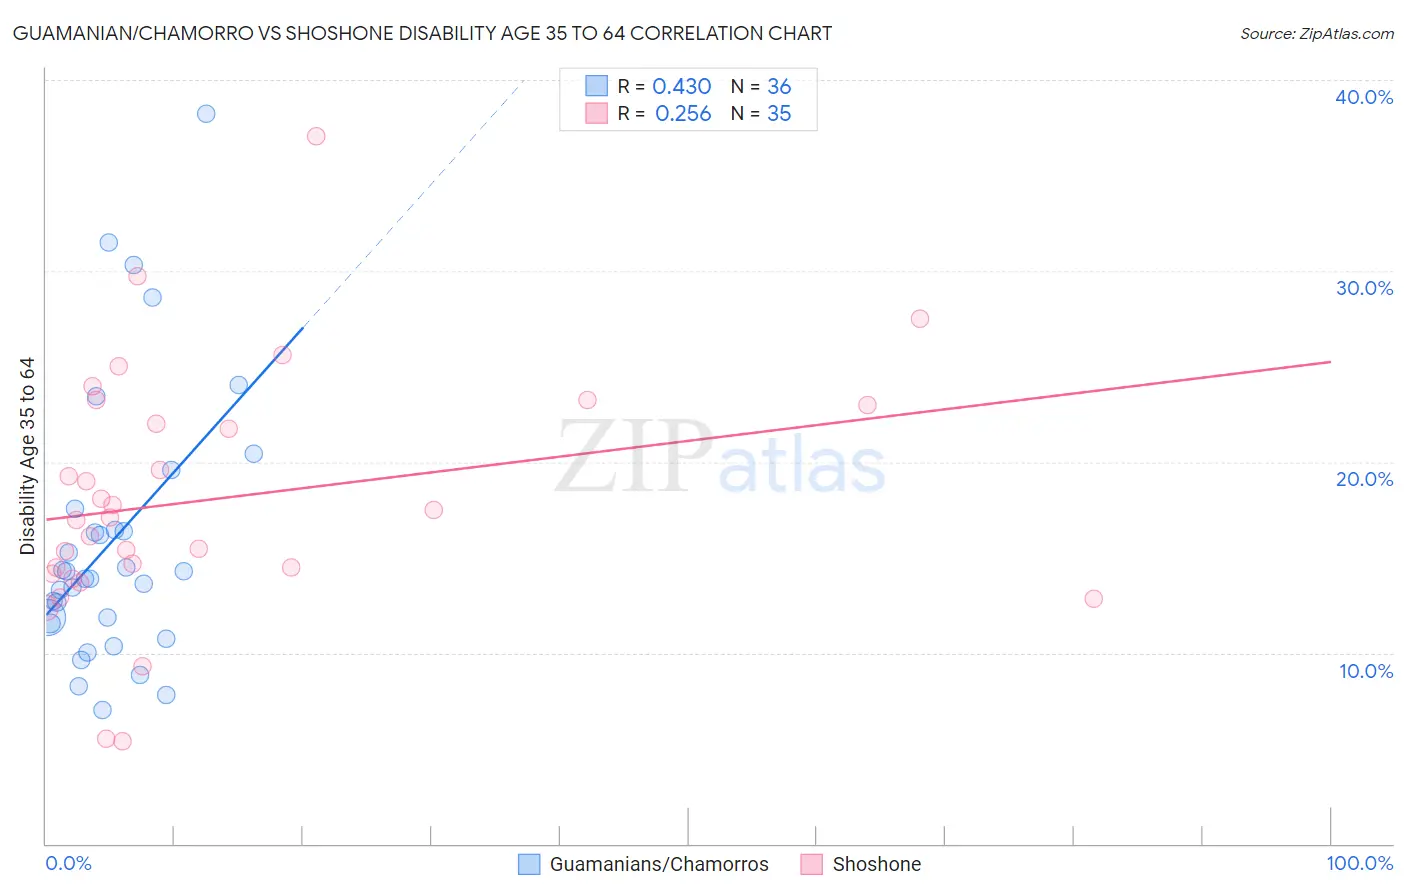
Guamanian/Chamorro vs Shoshone Disability Age 35 to 64 Correlation Chart
The statistical analysis conducted on geographies consisting of 221,858,951 people shows a moderate positive correlation between the proportion of Guamanians/Chamorros and percentage of population with a disability between the ages 34 and 64 in the United States with a correlation coefficient (R) of 0.430 and weighted average of 12.2%. Similarly, the statistical analysis conducted on geographies consisting of 66,618,836 people shows a weak positive correlation between the proportion of Shoshone and percentage of population with a disability between the ages 34 and 64 in the United States with a correlation coefficient (R) of 0.256 and weighted average of 14.5%, a difference of 18.1%.
Disability Age 35 to 64 Correlation Summary
| Measurement | Guamanian/Chamorro | Shoshone |
| Minimum | 7.0% | 5.4% |
| Maximum | 38.2% | 37.1% |
| Range | 31.2% | 31.7% |
| Mean | 15.9% | 18.1% |
| Median | 14.1% | 17.1% |
| Interquartile 25% (IQ1) | 11.7% | 14.1% |
| Interquartile 75% (IQ3) | 17.0% | 23.0% |
| Interquartile Range (IQR) | 5.3% | 8.9% |
| Standard Deviation (Sample) | 7.1% | 6.5% |
| Standard Deviation (Population) | 7.0% | 6.4% |
Similar Demographics by Disability Age 35 to 64
Demographics Similar to Guamanians/Chamorros by Disability Age 35 to 64
In terms of disability age 35 to 64, the demographic groups most similar to Guamanians/Chamorros are Immigrants from Senegal (12.2%, a difference of 0.040%), Spaniard (12.3%, a difference of 0.13%), Hispanic or Latino (12.3%, a difference of 0.16%), Immigrants from Burma/Myanmar (12.3%, a difference of 0.29%), and German (12.3%, a difference of 0.37%).
| Demographics | Rating | Rank | Disability Age 35 to 64 |
| Immigrants | Western Africa | 3.3 /100 | #239 | Tragic 12.0% |
| Immigrants | Thailand | 3.3 /100 | #240 | Tragic 12.0% |
| Mexican American Indians | 3.2 /100 | #241 | Tragic 12.0% |
| Samoans | 2.8 /100 | #242 | Tragic 12.1% |
| Slovaks | 2.7 /100 | #243 | Tragic 12.1% |
| Finns | 2.3 /100 | #244 | Tragic 12.1% |
| Immigrants | Mexico | 2.2 /100 | #245 | Tragic 12.1% |
| Guamanians/Chamorros | 1.4 /100 | #246 | Tragic 12.2% |
| Immigrants | Senegal | 1.3 /100 | #247 | Tragic 12.2% |
| Spaniards | 1.3 /100 | #248 | Tragic 12.3% |
| Hispanics or Latinos | 1.3 /100 | #249 | Tragic 12.3% |
| Immigrants | Burma/Myanmar | 1.2 /100 | #250 | Tragic 12.3% |
| Germans | 1.1 /100 | #251 | Tragic 12.3% |
| Irish | 1.0 /100 | #252 | Tragic 12.3% |
| Dutch | 1.0 /100 | #253 | Tragic 12.3% |
Demographics Similar to Shoshone by Disability Age 35 to 64
In terms of disability age 35 to 64, the demographic groups most similar to Shoshone are Alaska Native (14.5%, a difference of 0.020%), Osage (14.5%, a difference of 0.21%), Iroquois (14.4%, a difference of 0.76%), Crow (14.6%, a difference of 1.1%), and Ottawa (14.6%, a difference of 1.2%).
| Demographics | Rating | Rank | Disability Age 35 to 64 |
| Blackfeet | 0.0 /100 | #307 | Tragic 14.1% |
| Inupiat | 0.0 /100 | #308 | Tragic 14.1% |
| Cree | 0.0 /100 | #309 | Tragic 14.1% |
| Cape Verdeans | 0.0 /100 | #310 | Tragic 14.1% |
| Immigrants | Azores | 0.0 /100 | #311 | Tragic 14.3% |
| Paiute | 0.0 /100 | #312 | Tragic 14.3% |
| Iroquois | 0.0 /100 | #313 | Tragic 14.4% |
| Shoshone | 0.0 /100 | #314 | Tragic 14.5% |
| Alaska Natives | 0.0 /100 | #315 | Tragic 14.5% |
| Osage | 0.0 /100 | #316 | Tragic 14.5% |
| Crow | 0.0 /100 | #317 | Tragic 14.6% |
| Ottawa | 0.0 /100 | #318 | Tragic 14.6% |
| Immigrants | Cabo Verde | 0.0 /100 | #319 | Tragic 14.7% |
| Blacks/African Americans | 0.0 /100 | #320 | Tragic 14.7% |
| Comanche | 0.0 /100 | #321 | Tragic 14.7% |