Immigrants from Cabo Verde vs Pima Disability Age 35 to 64
COMPARE
Immigrants from Cabo Verde
Pima
Disability Age 35 to 64
Disability Age 35 to 64 Comparison
Immigrants from Cabo Verde
Pima
14.7%
DISABILITY AGE 35 TO 64
0.0/ 100
METRIC RATING
319th/ 347
METRIC RANK
16.1%
DISABILITY AGE 35 TO 64
0.0/ 100
METRIC RATING
339th/ 347
METRIC RANK
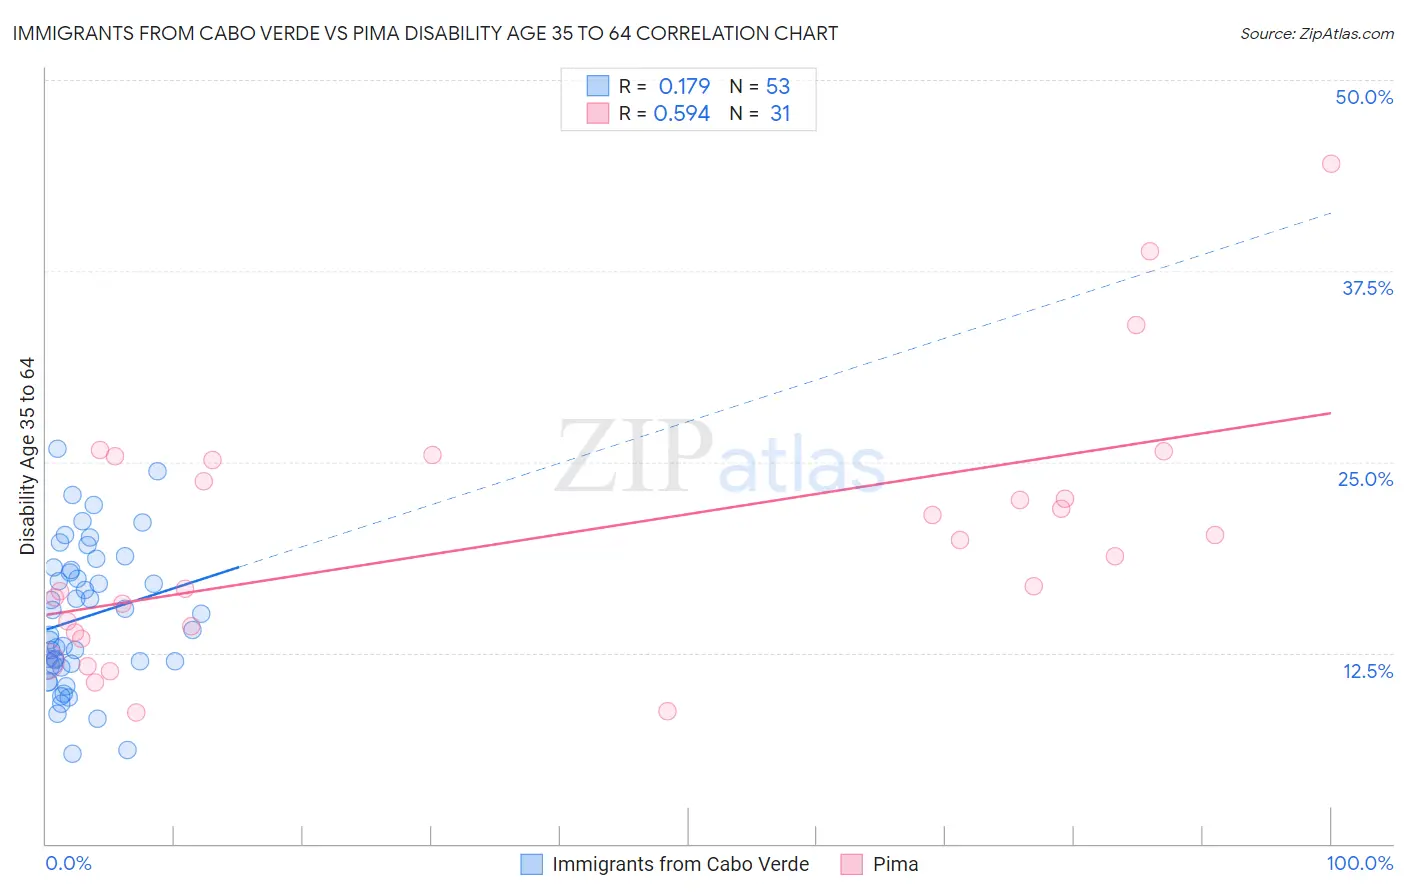
Immigrants from Cabo Verde vs Pima Disability Age 35 to 64 Correlation Chart
The statistical analysis conducted on geographies consisting of 38,131,070 people shows a poor positive correlation between the proportion of Immigrants from Cabo Verde and percentage of population with a disability between the ages 34 and 64 in the United States with a correlation coefficient (R) of 0.179 and weighted average of 14.7%. Similarly, the statistical analysis conducted on geographies consisting of 61,540,994 people shows a substantial positive correlation between the proportion of Pima and percentage of population with a disability between the ages 34 and 64 in the United States with a correlation coefficient (R) of 0.594 and weighted average of 16.1%, a difference of 9.9%.
Disability Age 35 to 64 Correlation Summary
| Measurement | Immigrants from Cabo Verde | Pima |
| Minimum | 5.9% | 8.6% |
| Maximum | 25.8% | 44.5% |
| Range | 20.0% | 35.9% |
| Mean | 14.8% | 19.9% |
| Median | 14.0% | 18.9% |
| Interquartile 25% (IQ1) | 11.7% | 13.8% |
| Interquartile 75% (IQ3) | 18.0% | 25.1% |
| Interquartile Range (IQR) | 6.3% | 11.3% |
| Standard Deviation (Sample) | 4.6% | 8.4% |
| Standard Deviation (Population) | 4.6% | 8.2% |
Demographics Similar to Immigrants from Cabo Verde and Pima by Disability Age 35 to 64
In terms of disability age 35 to 64, the demographic groups most similar to Immigrants from Cabo Verde are Black/African American (14.7%, a difference of 0.15%), Comanche (14.7%, a difference of 0.41%), Potawatomi (14.8%, a difference of 0.45%), Apache (14.9%, a difference of 1.7%), and Chippewa (15.0%, a difference of 1.9%). Similarly, the demographic groups most similar to Pima are Chickasaw (16.1%, a difference of 0.20%), Puerto Rican (15.9%, a difference of 1.2%), Menominee (15.9%, a difference of 1.6%), Seminole (15.9%, a difference of 1.8%), and Colville (15.8%, a difference of 1.9%).
| Demographics | Rating | Rank | Disability Age 35 to 64 |
| Immigrants | Cabo Verde | 0.0 /100 | #319 | Tragic 14.7% |
| Blacks/African Americans | 0.0 /100 | #320 | Tragic 14.7% |
| Comanche | 0.0 /100 | #321 | Tragic 14.7% |
| Potawatomi | 0.0 /100 | #322 | Tragic 14.8% |
| Apache | 0.0 /100 | #323 | Tragic 14.9% |
| Chippewa | 0.0 /100 | #324 | Tragic 15.0% |
| Arapaho | 0.0 /100 | #325 | Tragic 15.1% |
| Natives/Alaskans | 0.0 /100 | #326 | Tragic 15.3% |
| Pueblo | 0.0 /100 | #327 | Tragic 15.3% |
| Cajuns | 0.0 /100 | #328 | Tragic 15.3% |
| Cherokee | 0.0 /100 | #329 | Tragic 15.5% |
| Navajo | 0.0 /100 | #330 | Tragic 15.5% |
| Dutch West Indians | 0.0 /100 | #331 | Tragic 15.6% |
| Alaskan Athabascans | 0.0 /100 | #332 | Tragic 15.7% |
| Yuman | 0.0 /100 | #333 | Tragic 15.8% |
| Colville | 0.0 /100 | #334 | Tragic 15.8% |
| Seminole | 0.0 /100 | #335 | Tragic 15.9% |
| Menominee | 0.0 /100 | #336 | Tragic 15.9% |
| Puerto Ricans | 0.0 /100 | #337 | Tragic 15.9% |
| Chickasaw | 0.0 /100 | #338 | Tragic 16.1% |
| Pima | 0.0 /100 | #339 | Tragic 16.1% |