Guamanian/Chamorro vs Fijian Disability Age 35 to 64
COMPARE
Guamanian/Chamorro
Fijian
Disability Age 35 to 64
Disability Age 35 to 64 Comparison
Guamanians/Chamorros
Fijians
12.2%
DISABILITY AGE 35 TO 64
1.4/ 100
METRIC RATING
246th/ 347
METRIC RANK
13.2%
DISABILITY AGE 35 TO 64
0.0/ 100
METRIC RATING
288th/ 347
METRIC RANK
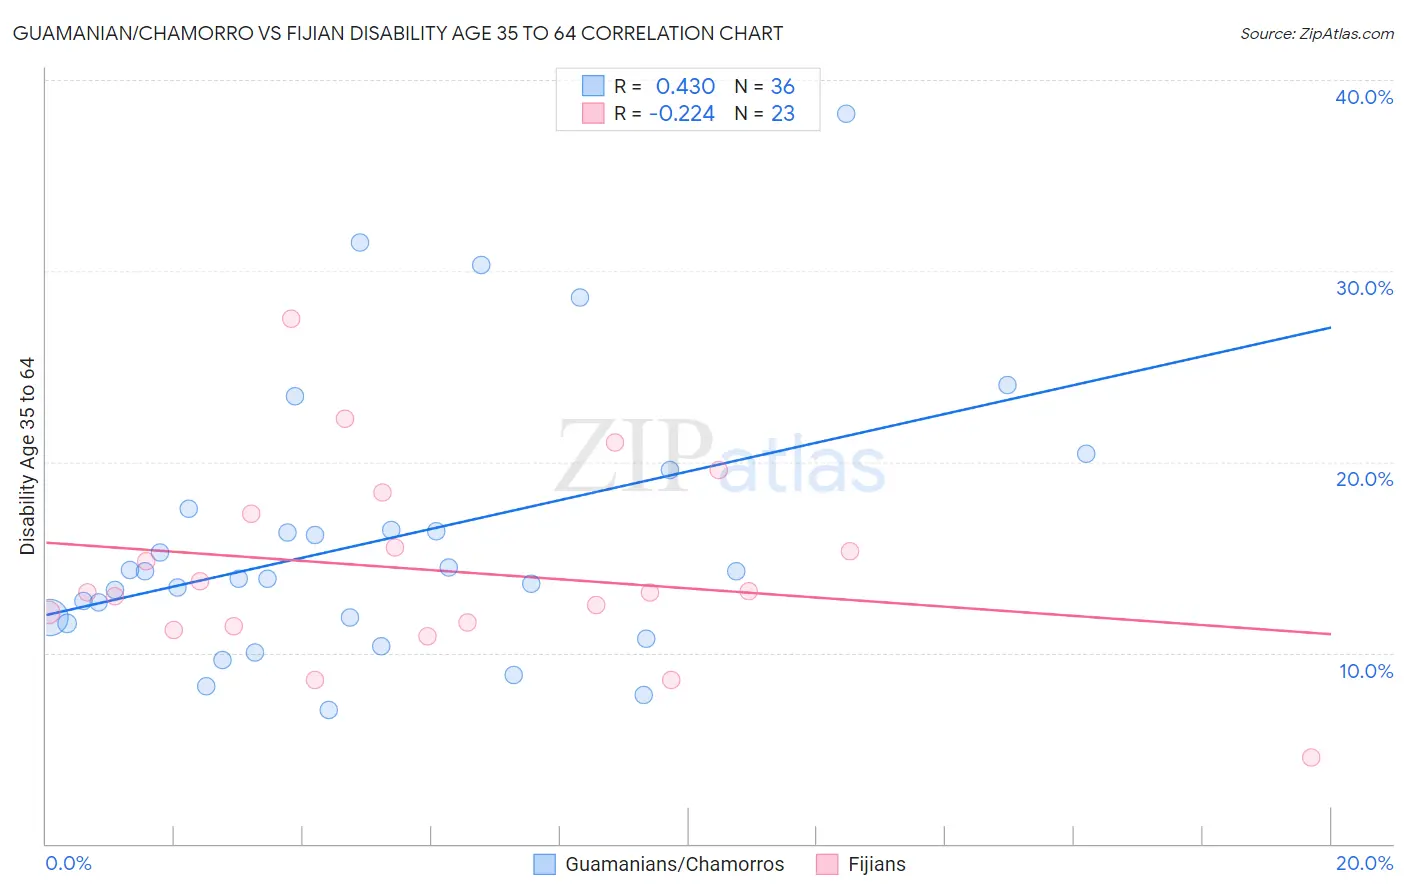
Guamanian/Chamorro vs Fijian Disability Age 35 to 64 Correlation Chart
The statistical analysis conducted on geographies consisting of 221,858,951 people shows a moderate positive correlation between the proportion of Guamanians/Chamorros and percentage of population with a disability between the ages 34 and 64 in the United States with a correlation coefficient (R) of 0.430 and weighted average of 12.2%. Similarly, the statistical analysis conducted on geographies consisting of 55,946,690 people shows a weak negative correlation between the proportion of Fijians and percentage of population with a disability between the ages 34 and 64 in the United States with a correlation coefficient (R) of -0.224 and weighted average of 13.2%, a difference of 8.1%.
Disability Age 35 to 64 Correlation Summary
| Measurement | Guamanian/Chamorro | Fijian |
| Minimum | 7.0% | 4.5% |
| Maximum | 38.2% | 27.5% |
| Range | 31.2% | 22.9% |
| Mean | 15.9% | 14.3% |
| Median | 14.1% | 13.2% |
| Interquartile 25% (IQ1) | 11.7% | 11.4% |
| Interquartile 75% (IQ3) | 17.0% | 17.3% |
| Interquartile Range (IQR) | 5.3% | 5.9% |
| Standard Deviation (Sample) | 7.1% | 5.0% |
| Standard Deviation (Population) | 7.0% | 4.9% |
Similar Demographics by Disability Age 35 to 64
Demographics Similar to Guamanians/Chamorros by Disability Age 35 to 64
In terms of disability age 35 to 64, the demographic groups most similar to Guamanians/Chamorros are Immigrants from Senegal (12.2%, a difference of 0.040%), Spaniard (12.3%, a difference of 0.13%), Hispanic or Latino (12.3%, a difference of 0.16%), Immigrants from Burma/Myanmar (12.3%, a difference of 0.29%), and German (12.3%, a difference of 0.37%).
| Demographics | Rating | Rank | Disability Age 35 to 64 |
| Immigrants | Western Africa | 3.3 /100 | #239 | Tragic 12.0% |
| Immigrants | Thailand | 3.3 /100 | #240 | Tragic 12.0% |
| Mexican American Indians | 3.2 /100 | #241 | Tragic 12.0% |
| Samoans | 2.8 /100 | #242 | Tragic 12.1% |
| Slovaks | 2.7 /100 | #243 | Tragic 12.1% |
| Finns | 2.3 /100 | #244 | Tragic 12.1% |
| Immigrants | Mexico | 2.2 /100 | #245 | Tragic 12.1% |
| Guamanians/Chamorros | 1.4 /100 | #246 | Tragic 12.2% |
| Immigrants | Senegal | 1.3 /100 | #247 | Tragic 12.2% |
| Spaniards | 1.3 /100 | #248 | Tragic 12.3% |
| Hispanics or Latinos | 1.3 /100 | #249 | Tragic 12.3% |
| Immigrants | Burma/Myanmar | 1.2 /100 | #250 | Tragic 12.3% |
| Germans | 1.1 /100 | #251 | Tragic 12.3% |
| Irish | 1.0 /100 | #252 | Tragic 12.3% |
| Dutch | 1.0 /100 | #253 | Tragic 12.3% |
Demographics Similar to Fijians by Disability Age 35 to 64
In terms of disability age 35 to 64, the demographic groups most similar to Fijians are Indonesian (13.2%, a difference of 0.070%), Immigrants from Liberia (13.2%, a difference of 0.15%), Tlingit-Haida (13.2%, a difference of 0.35%), Hmong (13.1%, a difference of 0.62%), and Immigrants from Congo (13.3%, a difference of 0.66%).
| Demographics | Rating | Rank | Disability Age 35 to 64 |
| Scotch-Irish | 0.1 /100 | #281 | Tragic 13.0% |
| Immigrants | Laos | 0.1 /100 | #282 | Tragic 13.0% |
| Central American Indians | 0.0 /100 | #283 | Tragic 13.0% |
| Immigrants | Nonimmigrants | 0.0 /100 | #284 | Tragic 13.0% |
| Immigrants | Somalia | 0.0 /100 | #285 | Tragic 13.1% |
| Hmong | 0.0 /100 | #286 | Tragic 13.1% |
| Tlingit-Haida | 0.0 /100 | #287 | Tragic 13.2% |
| Fijians | 0.0 /100 | #288 | Tragic 13.2% |
| Indonesians | 0.0 /100 | #289 | Tragic 13.2% |
| Immigrants | Liberia | 0.0 /100 | #290 | Tragic 13.2% |
| Immigrants | Congo | 0.0 /100 | #291 | Tragic 13.3% |
| Puget Sound Salish | 0.0 /100 | #292 | Tragic 13.3% |
| Ute | 0.0 /100 | #293 | Tragic 13.4% |
| Yaqui | 0.0 /100 | #294 | Tragic 13.5% |
| Yakama | 0.0 /100 | #295 | Tragic 13.6% |