Guamanian/Chamorro vs Vietnamese Disability Age 35 to 64
COMPARE
Guamanian/Chamorro
Vietnamese
Disability Age 35 to 64
Disability Age 35 to 64 Comparison
Guamanians/Chamorros
Vietnamese
12.2%
DISABILITY AGE 35 TO 64
1.4/ 100
METRIC RATING
246th/ 347
METRIC RANK
10.6%
DISABILITY AGE 35 TO 64
95.4/ 100
METRIC RATING
120th/ 347
METRIC RANK
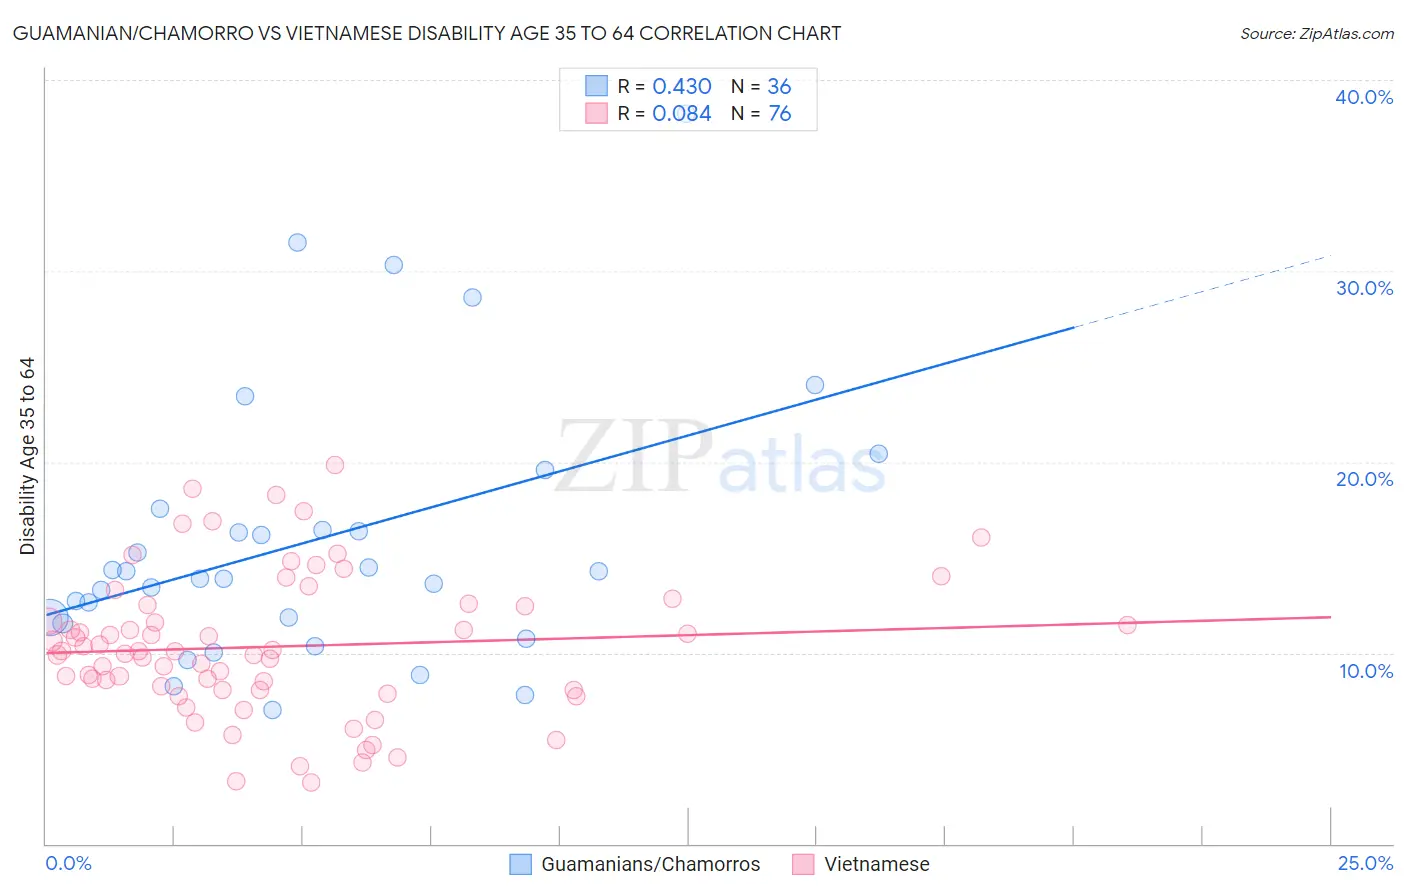
Guamanian/Chamorro vs Vietnamese Disability Age 35 to 64 Correlation Chart
The statistical analysis conducted on geographies consisting of 221,858,951 people shows a moderate positive correlation between the proportion of Guamanians/Chamorros and percentage of population with a disability between the ages 34 and 64 in the United States with a correlation coefficient (R) of 0.430 and weighted average of 12.2%. Similarly, the statistical analysis conducted on geographies consisting of 170,653,846 people shows a slight positive correlation between the proportion of Vietnamese and percentage of population with a disability between the ages 34 and 64 in the United States with a correlation coefficient (R) of 0.084 and weighted average of 10.6%, a difference of 15.6%.
Disability Age 35 to 64 Correlation Summary
| Measurement | Guamanian/Chamorro | Vietnamese |
| Minimum | 7.0% | 3.2% |
| Maximum | 38.2% | 19.9% |
| Range | 31.2% | 16.7% |
| Mean | 15.9% | 10.3% |
| Median | 14.1% | 10.1% |
| Interquartile 25% (IQ1) | 11.7% | 8.0% |
| Interquartile 75% (IQ3) | 17.0% | 12.5% |
| Interquartile Range (IQR) | 5.3% | 4.4% |
| Standard Deviation (Sample) | 7.1% | 3.7% |
| Standard Deviation (Population) | 7.0% | 3.6% |
Similar Demographics by Disability Age 35 to 64
Demographics Similar to Guamanians/Chamorros by Disability Age 35 to 64
In terms of disability age 35 to 64, the demographic groups most similar to Guamanians/Chamorros are Immigrants from Senegal (12.2%, a difference of 0.040%), Spaniard (12.3%, a difference of 0.13%), Hispanic or Latino (12.3%, a difference of 0.16%), Immigrants from Burma/Myanmar (12.3%, a difference of 0.29%), and German (12.3%, a difference of 0.37%).
| Demographics | Rating | Rank | Disability Age 35 to 64 |
| Immigrants | Western Africa | 3.3 /100 | #239 | Tragic 12.0% |
| Immigrants | Thailand | 3.3 /100 | #240 | Tragic 12.0% |
| Mexican American Indians | 3.2 /100 | #241 | Tragic 12.0% |
| Samoans | 2.8 /100 | #242 | Tragic 12.1% |
| Slovaks | 2.7 /100 | #243 | Tragic 12.1% |
| Finns | 2.3 /100 | #244 | Tragic 12.1% |
| Immigrants | Mexico | 2.2 /100 | #245 | Tragic 12.1% |
| Guamanians/Chamorros | 1.4 /100 | #246 | Tragic 12.2% |
| Immigrants | Senegal | 1.3 /100 | #247 | Tragic 12.2% |
| Spaniards | 1.3 /100 | #248 | Tragic 12.3% |
| Hispanics or Latinos | 1.3 /100 | #249 | Tragic 12.3% |
| Immigrants | Burma/Myanmar | 1.2 /100 | #250 | Tragic 12.3% |
| Germans | 1.1 /100 | #251 | Tragic 12.3% |
| Irish | 1.0 /100 | #252 | Tragic 12.3% |
| Dutch | 1.0 /100 | #253 | Tragic 12.3% |
Demographics Similar to Vietnamese by Disability Age 35 to 64
In terms of disability age 35 to 64, the demographic groups most similar to Vietnamese are Luxembourger (10.6%, a difference of 0.020%), Immigrants from Moldova (10.6%, a difference of 0.070%), Immigrants from South Eastern Asia (10.6%, a difference of 0.16%), Romanian (10.6%, a difference of 0.17%), and Immigrants from Norway (10.6%, a difference of 0.20%).
| Demographics | Rating | Rank | Disability Age 35 to 64 |
| Tongans | 96.6 /100 | #113 | Exceptional 10.5% |
| Immigrants | Morocco | 96.6 /100 | #114 | Exceptional 10.5% |
| Immigrants | Netherlands | 96.3 /100 | #115 | Exceptional 10.5% |
| Immigrants | Nepal | 95.9 /100 | #116 | Exceptional 10.6% |
| Immigrants | South Eastern Asia | 95.7 /100 | #117 | Exceptional 10.6% |
| Immigrants | Moldova | 95.5 /100 | #118 | Exceptional 10.6% |
| Luxembourgers | 95.5 /100 | #119 | Exceptional 10.6% |
| Vietnamese | 95.4 /100 | #120 | Exceptional 10.6% |
| Romanians | 95.0 /100 | #121 | Exceptional 10.6% |
| Immigrants | Norway | 95.0 /100 | #122 | Exceptional 10.6% |
| Maltese | 94.8 /100 | #123 | Exceptional 10.6% |
| Estonians | 94.5 /100 | #124 | Exceptional 10.6% |
| Albanians | 94.2 /100 | #125 | Exceptional 10.6% |
| Immigrants | Afghanistan | 94.1 /100 | #126 | Exceptional 10.6% |
| Immigrants | Zimbabwe | 94.0 /100 | #127 | Exceptional 10.6% |