Central American Indian vs Pima Disability Age 35 to 64
COMPARE
Central American Indian
Pima
Disability Age 35 to 64
Disability Age 35 to 64 Comparison
Central American Indians
Pima
13.0%
DISABILITY AGE 35 TO 64
0.0/ 100
METRIC RATING
283rd/ 347
METRIC RANK
16.1%
DISABILITY AGE 35 TO 64
0.0/ 100
METRIC RATING
339th/ 347
METRIC RANK
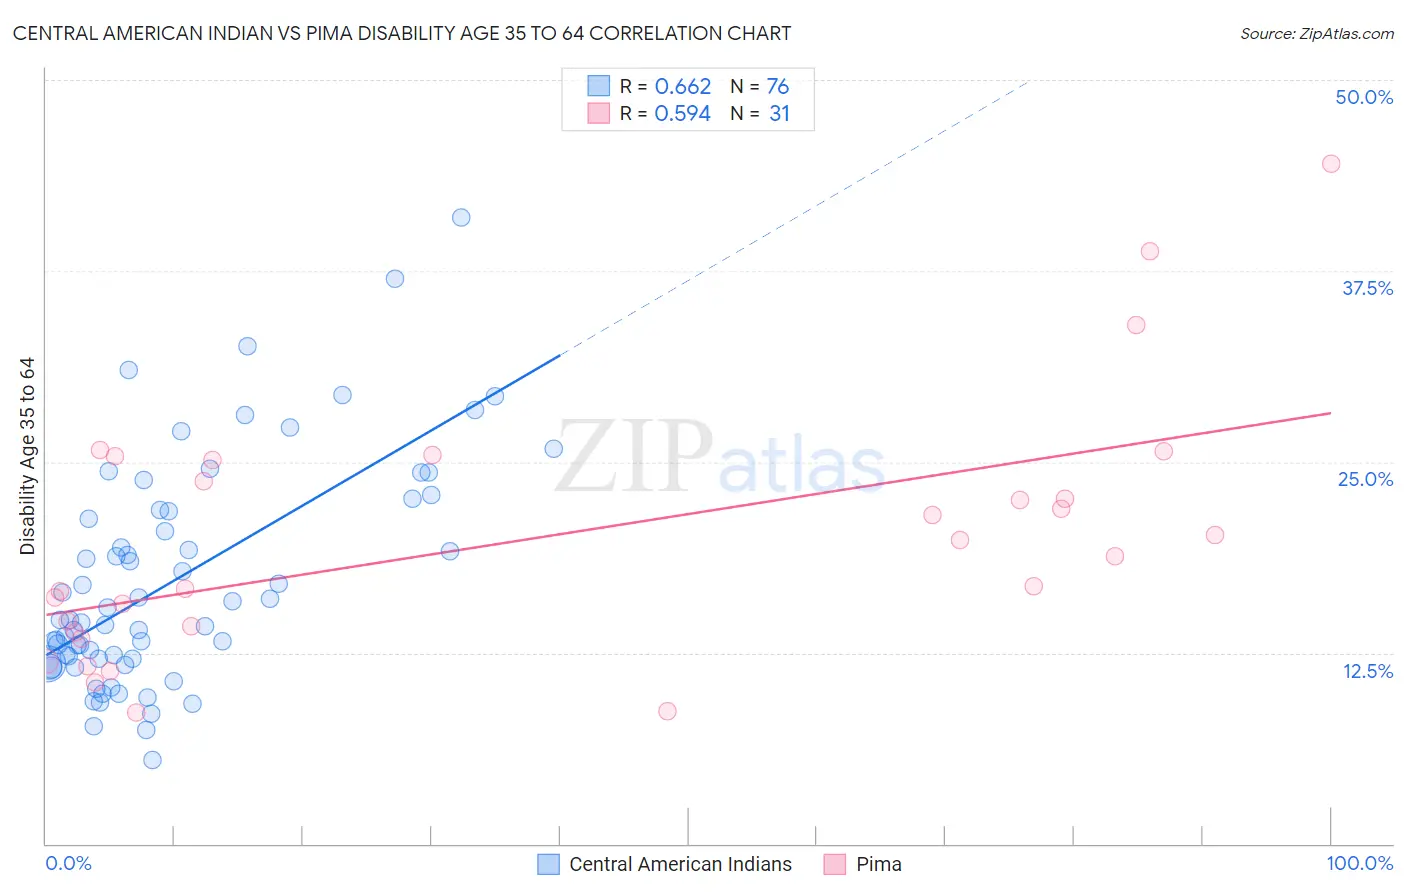
Central American Indian vs Pima Disability Age 35 to 64 Correlation Chart
The statistical analysis conducted on geographies consisting of 326,070,583 people shows a significant positive correlation between the proportion of Central American Indians and percentage of population with a disability between the ages 34 and 64 in the United States with a correlation coefficient (R) of 0.662 and weighted average of 13.0%. Similarly, the statistical analysis conducted on geographies consisting of 61,540,994 people shows a substantial positive correlation between the proportion of Pima and percentage of population with a disability between the ages 34 and 64 in the United States with a correlation coefficient (R) of 0.594 and weighted average of 16.1%, a difference of 23.9%.
Disability Age 35 to 64 Correlation Summary
| Measurement | Central American Indian | Pima |
| Minimum | 5.5% | 8.6% |
| Maximum | 41.0% | 44.5% |
| Range | 35.5% | 35.9% |
| Mean | 17.2% | 19.9% |
| Median | 14.6% | 18.9% |
| Interquartile 25% (IQ1) | 12.1% | 13.8% |
| Interquartile 75% (IQ3) | 21.8% | 25.1% |
| Interquartile Range (IQR) | 9.7% | 11.3% |
| Standard Deviation (Sample) | 7.3% | 8.4% |
| Standard Deviation (Population) | 7.2% | 8.2% |
Similar Demographics by Disability Age 35 to 64
Demographics Similar to Central American Indians by Disability Age 35 to 64
In terms of disability age 35 to 64, the demographic groups most similar to Central American Indians are Nonimmigrants (13.0%, a difference of 0.14%), Immigrants from Laos (13.0%, a difference of 0.39%), Scotch-Irish (13.0%, a difference of 0.49%), Immigrants from Somalia (13.1%, a difference of 0.58%), and Liberian (12.9%, a difference of 0.68%).
| Demographics | Rating | Rank | Disability Age 35 to 64 |
| Somalis | 0.1 /100 | #276 | Tragic 12.9% |
| Immigrants | Dominican Republic | 0.1 /100 | #277 | Tragic 12.9% |
| French Canadians | 0.1 /100 | #278 | Tragic 12.9% |
| Immigrants | Micronesia | 0.1 /100 | #279 | Tragic 12.9% |
| Liberians | 0.1 /100 | #280 | Tragic 12.9% |
| Scotch-Irish | 0.1 /100 | #281 | Tragic 13.0% |
| Immigrants | Laos | 0.1 /100 | #282 | Tragic 13.0% |
| Central American Indians | 0.0 /100 | #283 | Tragic 13.0% |
| Immigrants | Nonimmigrants | 0.0 /100 | #284 | Tragic 13.0% |
| Immigrants | Somalia | 0.0 /100 | #285 | Tragic 13.1% |
| Hmong | 0.0 /100 | #286 | Tragic 13.1% |
| Tlingit-Haida | 0.0 /100 | #287 | Tragic 13.2% |
| Fijians | 0.0 /100 | #288 | Tragic 13.2% |
| Indonesians | 0.0 /100 | #289 | Tragic 13.2% |
| Immigrants | Liberia | 0.0 /100 | #290 | Tragic 13.2% |
Demographics Similar to Pima by Disability Age 35 to 64
In terms of disability age 35 to 64, the demographic groups most similar to Pima are Chickasaw (16.1%, a difference of 0.20%), Puerto Rican (15.9%, a difference of 1.2%), Menominee (15.9%, a difference of 1.6%), Choctaw (16.4%, a difference of 1.7%), and Seminole (15.9%, a difference of 1.8%).
| Demographics | Rating | Rank | Disability Age 35 to 64 |
| Alaskan Athabascans | 0.0 /100 | #332 | Tragic 15.7% |
| Yuman | 0.0 /100 | #333 | Tragic 15.8% |
| Colville | 0.0 /100 | #334 | Tragic 15.8% |
| Seminole | 0.0 /100 | #335 | Tragic 15.9% |
| Menominee | 0.0 /100 | #336 | Tragic 15.9% |
| Puerto Ricans | 0.0 /100 | #337 | Tragic 15.9% |
| Chickasaw | 0.0 /100 | #338 | Tragic 16.1% |
| Pima | 0.0 /100 | #339 | Tragic 16.1% |
| Choctaw | 0.0 /100 | #340 | Tragic 16.4% |
| Tsimshian | 0.0 /100 | #341 | Tragic 16.7% |
| Tohono O'odham | 0.0 /100 | #342 | Tragic 16.7% |
| Creek | 0.0 /100 | #343 | Tragic 16.9% |
| Yup'ik | 0.0 /100 | #344 | Tragic 16.9% |
| Kiowa | 0.0 /100 | #345 | Tragic 17.4% |
| Lumbee | 0.0 /100 | #346 | Tragic 17.6% |