Celtic vs Subsaharan African Ambulatory Disability
COMPARE
Celtic
Subsaharan African
Ambulatory Disability
Ambulatory Disability Comparison
Celtics
Sub-Saharan Africans
6.7%
AMBULATORY DISABILITY
0.1/ 100
METRIC RATING
276th/ 347
METRIC RANK
6.4%
AMBULATORY DISABILITY
2.3/ 100
METRIC RATING
233rd/ 347
METRIC RANK
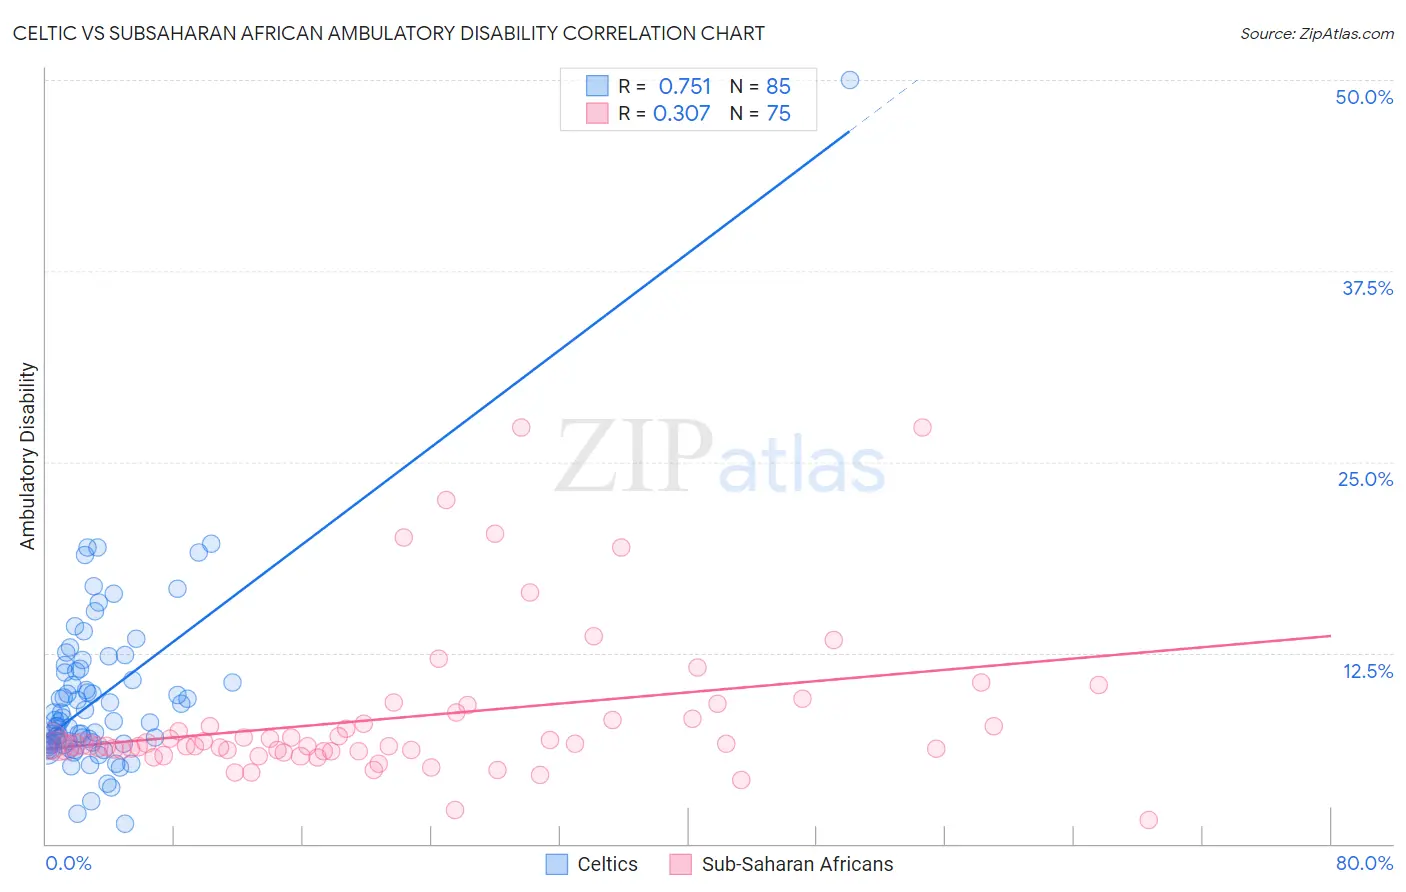
Celtic vs Subsaharan African Ambulatory Disability Correlation Chart
The statistical analysis conducted on geographies consisting of 168,862,473 people shows a strong positive correlation between the proportion of Celtics and percentage of population with ambulatory disability in the United States with a correlation coefficient (R) of 0.751 and weighted average of 6.7%. Similarly, the statistical analysis conducted on geographies consisting of 507,846,771 people shows a mild positive correlation between the proportion of Sub-Saharan Africans and percentage of population with ambulatory disability in the United States with a correlation coefficient (R) of 0.307 and weighted average of 6.4%, a difference of 4.6%.
Ambulatory Disability Correlation Summary
| Measurement | Celtic | Subsaharan African |
| Minimum | 1.3% | 1.5% |
| Maximum | 50.0% | 27.3% |
| Range | 48.7% | 25.7% |
| Mean | 9.7% | 8.3% |
| Median | 8.0% | 6.5% |
| Interquartile 25% (IQ1) | 6.5% | 6.1% |
| Interquartile 75% (IQ3) | 11.4% | 8.2% |
| Interquartile Range (IQR) | 4.8% | 2.1% |
| Standard Deviation (Sample) | 6.0% | 5.0% |
| Standard Deviation (Population) | 6.0% | 4.9% |
Similar Demographics by Ambulatory Disability
Demographics Similar to Celtics by Ambulatory Disability
In terms of ambulatory disability, the demographic groups most similar to Celtics are Immigrants from Guyana (6.7%, a difference of 0.030%), Jamaican (6.7%, a difference of 0.080%), Sioux (6.7%, a difference of 0.090%), Immigrants from West Indies (6.7%, a difference of 0.15%), and White/Caucasian (6.7%, a difference of 0.34%).
| Demographics | Rating | Rank | Ambulatory Disability |
| French | 0.1 /100 | #269 | Tragic 6.6% |
| Slovaks | 0.1 /100 | #270 | Tragic 6.7% |
| Immigrants | Trinidad and Tobago | 0.1 /100 | #271 | Tragic 6.7% |
| French Canadians | 0.1 /100 | #272 | Tragic 6.7% |
| Whites/Caucasians | 0.1 /100 | #273 | Tragic 6.7% |
| Sioux | 0.1 /100 | #274 | Tragic 6.7% |
| Immigrants | Guyana | 0.1 /100 | #275 | Tragic 6.7% |
| Celtics | 0.1 /100 | #276 | Tragic 6.7% |
| Jamaicans | 0.1 /100 | #277 | Tragic 6.7% |
| Immigrants | West Indies | 0.1 /100 | #278 | Tragic 6.7% |
| Immigrants | Caribbean | 0.0 /100 | #279 | Tragic 6.7% |
| Pennsylvania Germans | 0.0 /100 | #280 | Tragic 6.8% |
| Yaqui | 0.0 /100 | #281 | Tragic 6.8% |
| Barbadians | 0.0 /100 | #282 | Tragic 6.8% |
| Immigrants | Barbados | 0.0 /100 | #283 | Tragic 6.8% |
Demographics Similar to Sub-Saharan Africans by Ambulatory Disability
In terms of ambulatory disability, the demographic groups most similar to Sub-Saharan Africans are Immigrants from Liberia (6.4%, a difference of 0.030%), Assyrian/Chaldean/Syriac (6.4%, a difference of 0.060%), Hispanic or Latino (6.4%, a difference of 0.060%), Dutch (6.4%, a difference of 0.21%), and Immigrants from Germany (6.4%, a difference of 0.30%).
| Demographics | Rating | Rank | Ambulatory Disability |
| Slavs | 5.1 /100 | #226 | Tragic 6.4% |
| Cubans | 4.0 /100 | #227 | Tragic 6.4% |
| Portuguese | 4.0 /100 | #228 | Tragic 6.4% |
| Czechoslovakians | 3.8 /100 | #229 | Tragic 6.4% |
| Mexicans | 3.5 /100 | #230 | Tragic 6.4% |
| Panamanians | 3.1 /100 | #231 | Tragic 6.4% |
| Assyrians/Chaldeans/Syriacs | 2.4 /100 | #232 | Tragic 6.4% |
| Sub-Saharan Africans | 2.3 /100 | #233 | Tragic 6.4% |
| Immigrants | Liberia | 2.3 /100 | #234 | Tragic 6.4% |
| Hispanics or Latinos | 2.2 /100 | #235 | Tragic 6.4% |
| Dutch | 2.0 /100 | #236 | Tragic 6.4% |
| Immigrants | Germany | 1.8 /100 | #237 | Tragic 6.4% |
| Haitians | 1.8 /100 | #238 | Tragic 6.4% |
| Senegalese | 1.7 /100 | #239 | Tragic 6.4% |
| Immigrants | Senegal | 1.7 /100 | #240 | Tragic 6.4% |