Immigrants from Cuba vs Subsaharan African Ambulatory Disability
COMPARE
Immigrants from Cuba
Subsaharan African
Ambulatory Disability
Ambulatory Disability Comparison
Immigrants from Cuba
Sub-Saharan Africans
6.5%
AMBULATORY DISABILITY
1.4/ 100
METRIC RATING
247th/ 347
METRIC RANK
6.4%
AMBULATORY DISABILITY
2.3/ 100
METRIC RATING
233rd/ 347
METRIC RANK
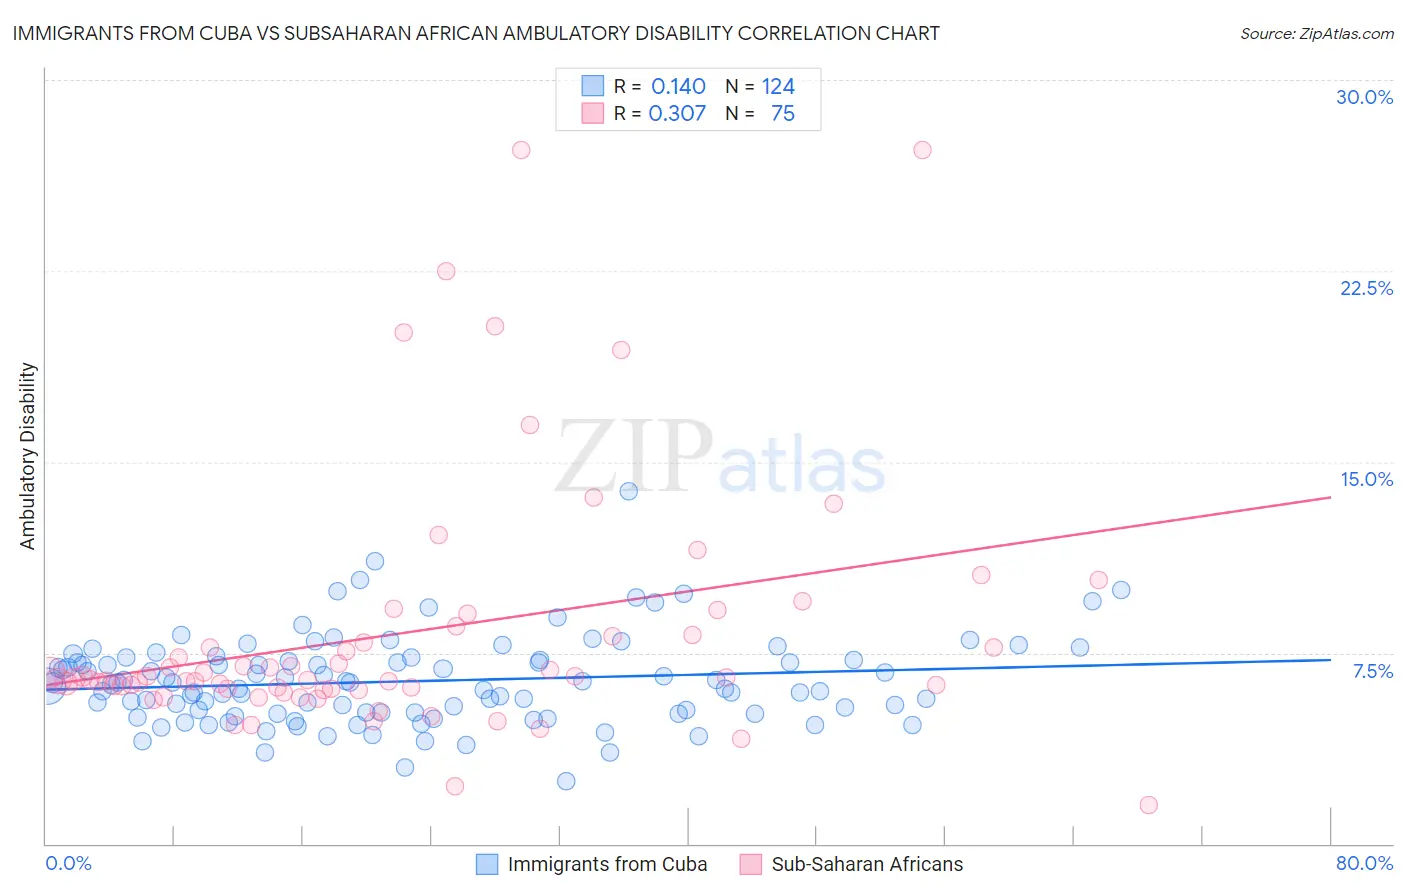
Immigrants from Cuba vs Subsaharan African Ambulatory Disability Correlation Chart
The statistical analysis conducted on geographies consisting of 325,985,542 people shows a poor positive correlation between the proportion of Immigrants from Cuba and percentage of population with ambulatory disability in the United States with a correlation coefficient (R) of 0.140 and weighted average of 6.5%. Similarly, the statistical analysis conducted on geographies consisting of 507,846,771 people shows a mild positive correlation between the proportion of Sub-Saharan Africans and percentage of population with ambulatory disability in the United States with a correlation coefficient (R) of 0.307 and weighted average of 6.4%, a difference of 0.64%.
Ambulatory Disability Correlation Summary
| Measurement | Immigrants from Cuba | Subsaharan African |
| Minimum | 2.5% | 1.5% |
| Maximum | 13.8% | 27.3% |
| Range | 11.4% | 25.7% |
| Mean | 6.4% | 8.3% |
| Median | 6.3% | 6.5% |
| Interquartile 25% (IQ1) | 5.2% | 6.1% |
| Interquartile 75% (IQ3) | 7.2% | 8.2% |
| Interquartile Range (IQR) | 2.1% | 2.1% |
| Standard Deviation (Sample) | 1.7% | 5.0% |
| Standard Deviation (Population) | 1.7% | 4.9% |
Demographics Similar to Immigrants from Cuba and Sub-Saharan Africans by Ambulatory Disability
In terms of ambulatory disability, the demographic groups most similar to Immigrants from Cuba are Immigrants from Portugal (6.5%, a difference of 0.020%), Armenian (6.5%, a difference of 0.050%), Tlingit-Haida (6.5%, a difference of 0.070%), German (6.5%, a difference of 0.10%), and Immigrants from Panama (6.5%, a difference of 0.10%). Similarly, the demographic groups most similar to Sub-Saharan Africans are Immigrants from Liberia (6.4%, a difference of 0.030%), Assyrian/Chaldean/Syriac (6.4%, a difference of 0.060%), Hispanic or Latino (6.4%, a difference of 0.060%), Dutch (6.4%, a difference of 0.21%), and Immigrants from Germany (6.4%, a difference of 0.30%).
| Demographics | Rating | Rank | Ambulatory Disability |
| Mexicans | 3.5 /100 | #230 | Tragic 6.4% |
| Panamanians | 3.1 /100 | #231 | Tragic 6.4% |
| Assyrians/Chaldeans/Syriacs | 2.4 /100 | #232 | Tragic 6.4% |
| Sub-Saharan Africans | 2.3 /100 | #233 | Tragic 6.4% |
| Immigrants | Liberia | 2.3 /100 | #234 | Tragic 6.4% |
| Hispanics or Latinos | 2.2 /100 | #235 | Tragic 6.4% |
| Dutch | 2.0 /100 | #236 | Tragic 6.4% |
| Immigrants | Germany | 1.8 /100 | #237 | Tragic 6.4% |
| Haitians | 1.8 /100 | #238 | Tragic 6.4% |
| Senegalese | 1.7 /100 | #239 | Tragic 6.4% |
| Immigrants | Senegal | 1.7 /100 | #240 | Tragic 6.4% |
| Immigrants | Haiti | 1.6 /100 | #241 | Tragic 6.5% |
| Spaniards | 1.6 /100 | #242 | Tragic 6.5% |
| Germans | 1.5 /100 | #243 | Tragic 6.5% |
| Immigrants | Panama | 1.5 /100 | #244 | Tragic 6.5% |
| Tlingit-Haida | 1.5 /100 | #245 | Tragic 6.5% |
| Armenians | 1.5 /100 | #246 | Tragic 6.5% |
| Immigrants | Cuba | 1.4 /100 | #247 | Tragic 6.5% |
| Immigrants | Portugal | 1.4 /100 | #248 | Tragic 6.5% |
| Native Hawaiians | 1.1 /100 | #249 | Tragic 6.5% |
| Chinese | 1.0 /100 | #250 | Tragic 6.5% |