Celtic vs Immigrants from Armenia Ambulatory Disability
COMPARE
Celtic
Immigrants from Armenia
Ambulatory Disability
Ambulatory Disability Comparison
Celtics
Immigrants from Armenia
6.7%
AMBULATORY DISABILITY
0.1/ 100
METRIC RATING
276th/ 347
METRIC RANK
7.0%
AMBULATORY DISABILITY
0.0/ 100
METRIC RATING
302nd/ 347
METRIC RANK
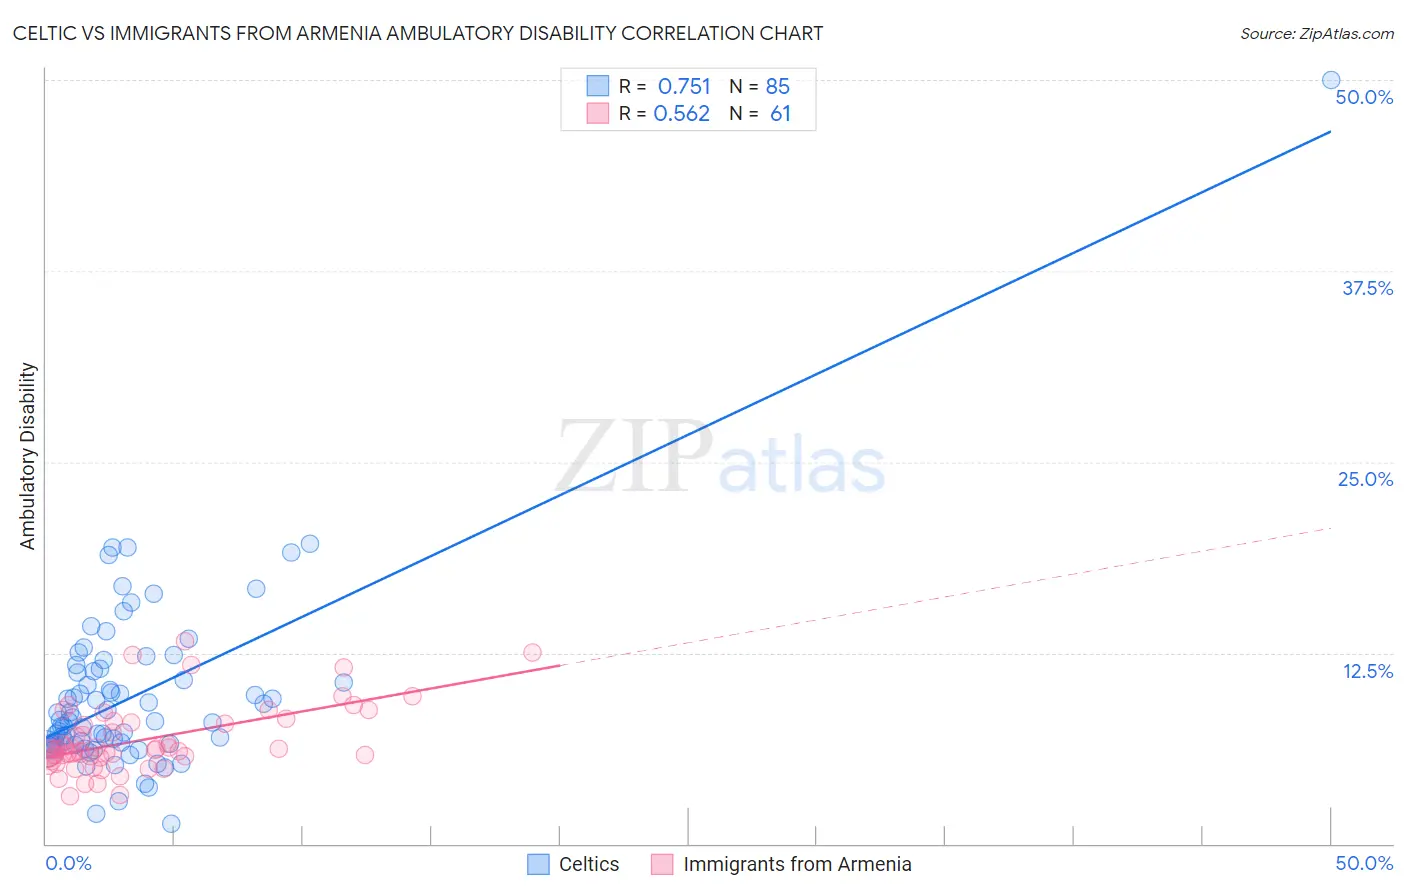
Celtic vs Immigrants from Armenia Ambulatory Disability Correlation Chart
The statistical analysis conducted on geographies consisting of 168,862,473 people shows a strong positive correlation between the proportion of Celtics and percentage of population with ambulatory disability in the United States with a correlation coefficient (R) of 0.751 and weighted average of 6.7%. Similarly, the statistical analysis conducted on geographies consisting of 97,709,765 people shows a substantial positive correlation between the proportion of Immigrants from Armenia and percentage of population with ambulatory disability in the United States with a correlation coefficient (R) of 0.562 and weighted average of 7.0%, a difference of 3.8%.
Ambulatory Disability Correlation Summary
| Measurement | Celtic | Immigrants from Armenia |
| Minimum | 1.3% | 3.1% |
| Maximum | 50.0% | 13.3% |
| Range | 48.7% | 10.2% |
| Mean | 9.7% | 6.8% |
| Median | 8.0% | 6.2% |
| Interquartile 25% (IQ1) | 6.5% | 5.6% |
| Interquartile 75% (IQ3) | 11.4% | 8.0% |
| Interquartile Range (IQR) | 4.8% | 2.3% |
| Standard Deviation (Sample) | 6.0% | 2.2% |
| Standard Deviation (Population) | 6.0% | 2.2% |
Similar Demographics by Ambulatory Disability
Demographics Similar to Celtics by Ambulatory Disability
In terms of ambulatory disability, the demographic groups most similar to Celtics are Immigrants from Guyana (6.7%, a difference of 0.030%), Jamaican (6.7%, a difference of 0.080%), Sioux (6.7%, a difference of 0.090%), Immigrants from West Indies (6.7%, a difference of 0.15%), and White/Caucasian (6.7%, a difference of 0.34%).
| Demographics | Rating | Rank | Ambulatory Disability |
| French | 0.1 /100 | #269 | Tragic 6.6% |
| Slovaks | 0.1 /100 | #270 | Tragic 6.7% |
| Immigrants | Trinidad and Tobago | 0.1 /100 | #271 | Tragic 6.7% |
| French Canadians | 0.1 /100 | #272 | Tragic 6.7% |
| Whites/Caucasians | 0.1 /100 | #273 | Tragic 6.7% |
| Sioux | 0.1 /100 | #274 | Tragic 6.7% |
| Immigrants | Guyana | 0.1 /100 | #275 | Tragic 6.7% |
| Celtics | 0.1 /100 | #276 | Tragic 6.7% |
| Jamaicans | 0.1 /100 | #277 | Tragic 6.7% |
| Immigrants | West Indies | 0.1 /100 | #278 | Tragic 6.7% |
| Immigrants | Caribbean | 0.0 /100 | #279 | Tragic 6.7% |
| Pennsylvania Germans | 0.0 /100 | #280 | Tragic 6.8% |
| Yaqui | 0.0 /100 | #281 | Tragic 6.8% |
| Barbadians | 0.0 /100 | #282 | Tragic 6.8% |
| Immigrants | Barbados | 0.0 /100 | #283 | Tragic 6.8% |
Demographics Similar to Immigrants from Armenia by Ambulatory Disability
In terms of ambulatory disability, the demographic groups most similar to Immigrants from Armenia are British West Indian (7.0%, a difference of 0.060%), African (7.0%, a difference of 0.060%), Marshallese (6.9%, a difference of 0.28%), Puget Sound Salish (6.9%, a difference of 0.30%), and Immigrants from Cabo Verde (7.0%, a difference of 0.42%).
| Demographics | Rating | Rank | Ambulatory Disability |
| Crow | 0.0 /100 | #295 | Tragic 6.9% |
| Alaskan Athabascans | 0.0 /100 | #296 | Tragic 6.9% |
| French American Indians | 0.0 /100 | #297 | Tragic 6.9% |
| Immigrants | Grenada | 0.0 /100 | #298 | Tragic 6.9% |
| Puget Sound Salish | 0.0 /100 | #299 | Tragic 6.9% |
| Marshallese | 0.0 /100 | #300 | Tragic 6.9% |
| British West Indians | 0.0 /100 | #301 | Tragic 7.0% |
| Immigrants | Armenia | 0.0 /100 | #302 | Tragic 7.0% |
| Africans | 0.0 /100 | #303 | Tragic 7.0% |
| Immigrants | Cabo Verde | 0.0 /100 | #304 | Tragic 7.0% |
| Immigrants | Micronesia | 0.0 /100 | #305 | Tragic 7.0% |
| Iroquois | 0.0 /100 | #306 | Tragic 7.1% |
| Spanish Americans | 0.0 /100 | #307 | Tragic 7.1% |
| Chippewa | 0.0 /100 | #308 | Tragic 7.1% |
| Immigrants | Azores | 0.0 /100 | #309 | Tragic 7.1% |