Celtic vs Welsh Ambulatory Disability
COMPARE
Celtic
Welsh
Ambulatory Disability
Ambulatory Disability Comparison
Celtics
Welsh
6.7%
AMBULATORY DISABILITY
0.1/ 100
METRIC RATING
276th/ 347
METRIC RANK
6.5%
AMBULATORY DISABILITY
0.6/ 100
METRIC RATING
255th/ 347
METRIC RANK
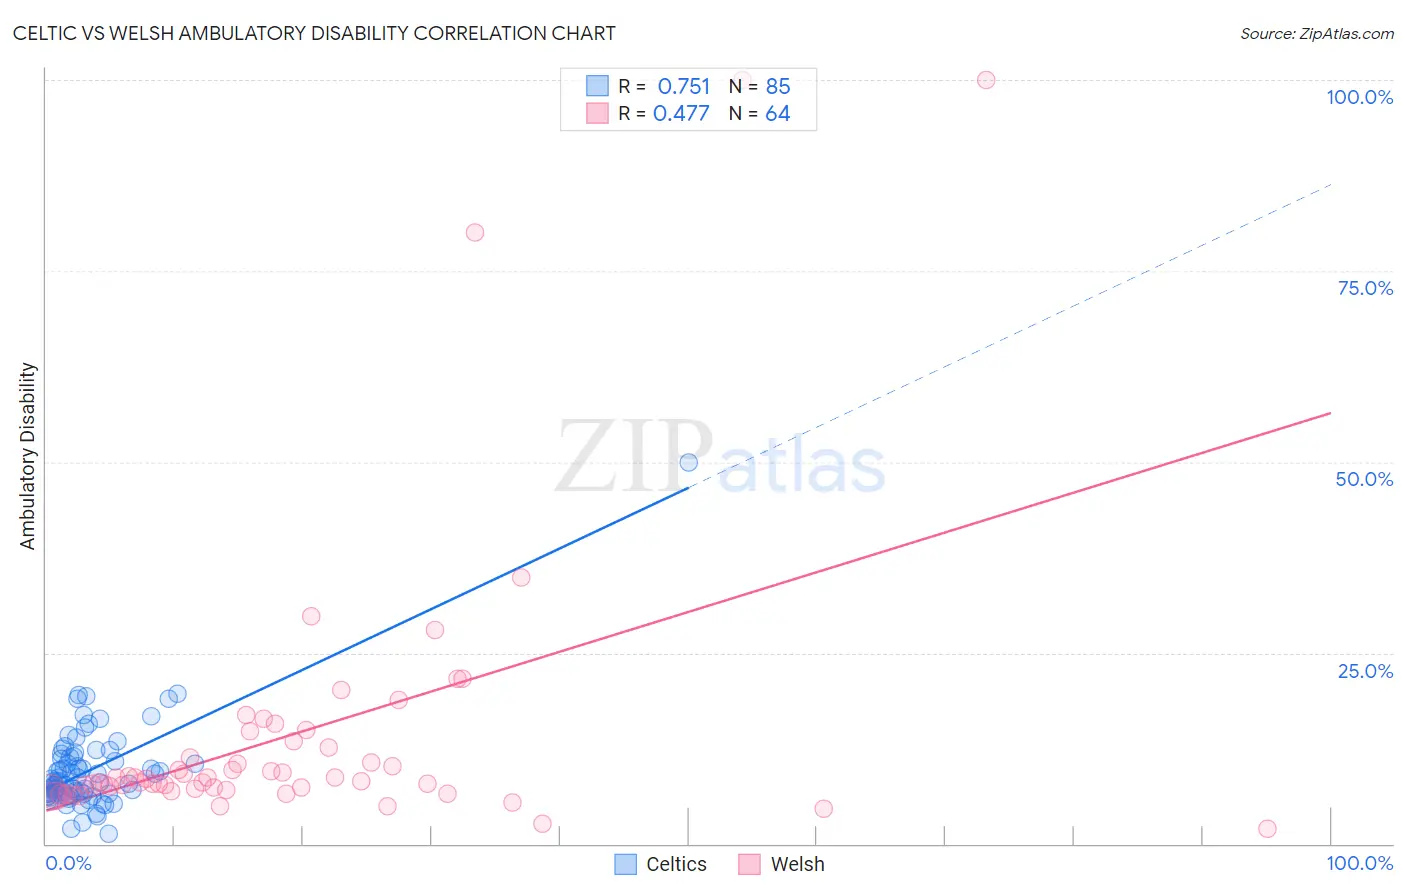
Celtic vs Welsh Ambulatory Disability Correlation Chart
The statistical analysis conducted on geographies consisting of 168,862,473 people shows a strong positive correlation between the proportion of Celtics and percentage of population with ambulatory disability in the United States with a correlation coefficient (R) of 0.751 and weighted average of 6.7%. Similarly, the statistical analysis conducted on geographies consisting of 528,297,668 people shows a moderate positive correlation between the proportion of Welsh and percentage of population with ambulatory disability in the United States with a correlation coefficient (R) of 0.477 and weighted average of 6.5%, a difference of 2.8%.
Ambulatory Disability Correlation Summary
| Measurement | Celtic | Welsh |
| Minimum | 1.3% | 2.0% |
| Maximum | 50.0% | 100.0% |
| Range | 48.7% | 98.0% |
| Mean | 9.7% | 14.3% |
| Median | 8.0% | 8.3% |
| Interquartile 25% (IQ1) | 6.5% | 7.1% |
| Interquartile 75% (IQ3) | 11.4% | 13.0% |
| Interquartile Range (IQR) | 4.8% | 5.9% |
| Standard Deviation (Sample) | 6.0% | 18.8% |
| Standard Deviation (Population) | 6.0% | 18.7% |
Similar Demographics by Ambulatory Disability
Demographics Similar to Celtics by Ambulatory Disability
In terms of ambulatory disability, the demographic groups most similar to Celtics are Immigrants from Guyana (6.7%, a difference of 0.030%), Jamaican (6.7%, a difference of 0.080%), Sioux (6.7%, a difference of 0.090%), Immigrants from West Indies (6.7%, a difference of 0.15%), and White/Caucasian (6.7%, a difference of 0.34%).
| Demographics | Rating | Rank | Ambulatory Disability |
| French | 0.1 /100 | #269 | Tragic 6.6% |
| Slovaks | 0.1 /100 | #270 | Tragic 6.7% |
| Immigrants | Trinidad and Tobago | 0.1 /100 | #271 | Tragic 6.7% |
| French Canadians | 0.1 /100 | #272 | Tragic 6.7% |
| Whites/Caucasians | 0.1 /100 | #273 | Tragic 6.7% |
| Sioux | 0.1 /100 | #274 | Tragic 6.7% |
| Immigrants | Guyana | 0.1 /100 | #275 | Tragic 6.7% |
| Celtics | 0.1 /100 | #276 | Tragic 6.7% |
| Jamaicans | 0.1 /100 | #277 | Tragic 6.7% |
| Immigrants | West Indies | 0.1 /100 | #278 | Tragic 6.7% |
| Immigrants | Caribbean | 0.0 /100 | #279 | Tragic 6.7% |
| Pennsylvania Germans | 0.0 /100 | #280 | Tragic 6.8% |
| Yaqui | 0.0 /100 | #281 | Tragic 6.8% |
| Barbadians | 0.0 /100 | #282 | Tragic 6.8% |
| Immigrants | Barbados | 0.0 /100 | #283 | Tragic 6.8% |
Demographics Similar to Welsh by Ambulatory Disability
In terms of ambulatory disability, the demographic groups most similar to Welsh are Belizean (6.5%, a difference of 0.070%), Immigrants from Uzbekistan (6.5%, a difference of 0.080%), Bermudan (6.5%, a difference of 0.16%), Scottish (6.5%, a difference of 0.23%), and Spanish American Indian (6.5%, a difference of 0.23%).
| Demographics | Rating | Rank | Ambulatory Disability |
| Immigrants | Portugal | 1.4 /100 | #248 | Tragic 6.5% |
| Native Hawaiians | 1.1 /100 | #249 | Tragic 6.5% |
| Chinese | 1.0 /100 | #250 | Tragic 6.5% |
| Hawaiians | 0.9 /100 | #251 | Tragic 6.5% |
| Immigrants | Bahamas | 0.8 /100 | #252 | Tragic 6.5% |
| Scottish | 0.7 /100 | #253 | Tragic 6.5% |
| Belizeans | 0.7 /100 | #254 | Tragic 6.5% |
| Welsh | 0.6 /100 | #255 | Tragic 6.5% |
| Immigrants | Uzbekistan | 0.6 /100 | #256 | Tragic 6.5% |
| Bermudans | 0.5 /100 | #257 | Tragic 6.5% |
| Spanish American Indians | 0.5 /100 | #258 | Tragic 6.5% |
| Aleuts | 0.4 /100 | #259 | Tragic 6.6% |
| Immigrants | Belize | 0.4 /100 | #260 | Tragic 6.6% |
| Irish | 0.4 /100 | #261 | Tragic 6.6% |
| English | 0.4 /100 | #262 | Tragic 6.6% |