Jamaican vs Subsaharan African Ambulatory Disability
COMPARE
Jamaican
Subsaharan African
Ambulatory Disability
Ambulatory Disability Comparison
Jamaicans
Sub-Saharan Africans
6.7%
AMBULATORY DISABILITY
0.1/ 100
METRIC RATING
277th/ 347
METRIC RANK
6.4%
AMBULATORY DISABILITY
2.3/ 100
METRIC RATING
233rd/ 347
METRIC RANK
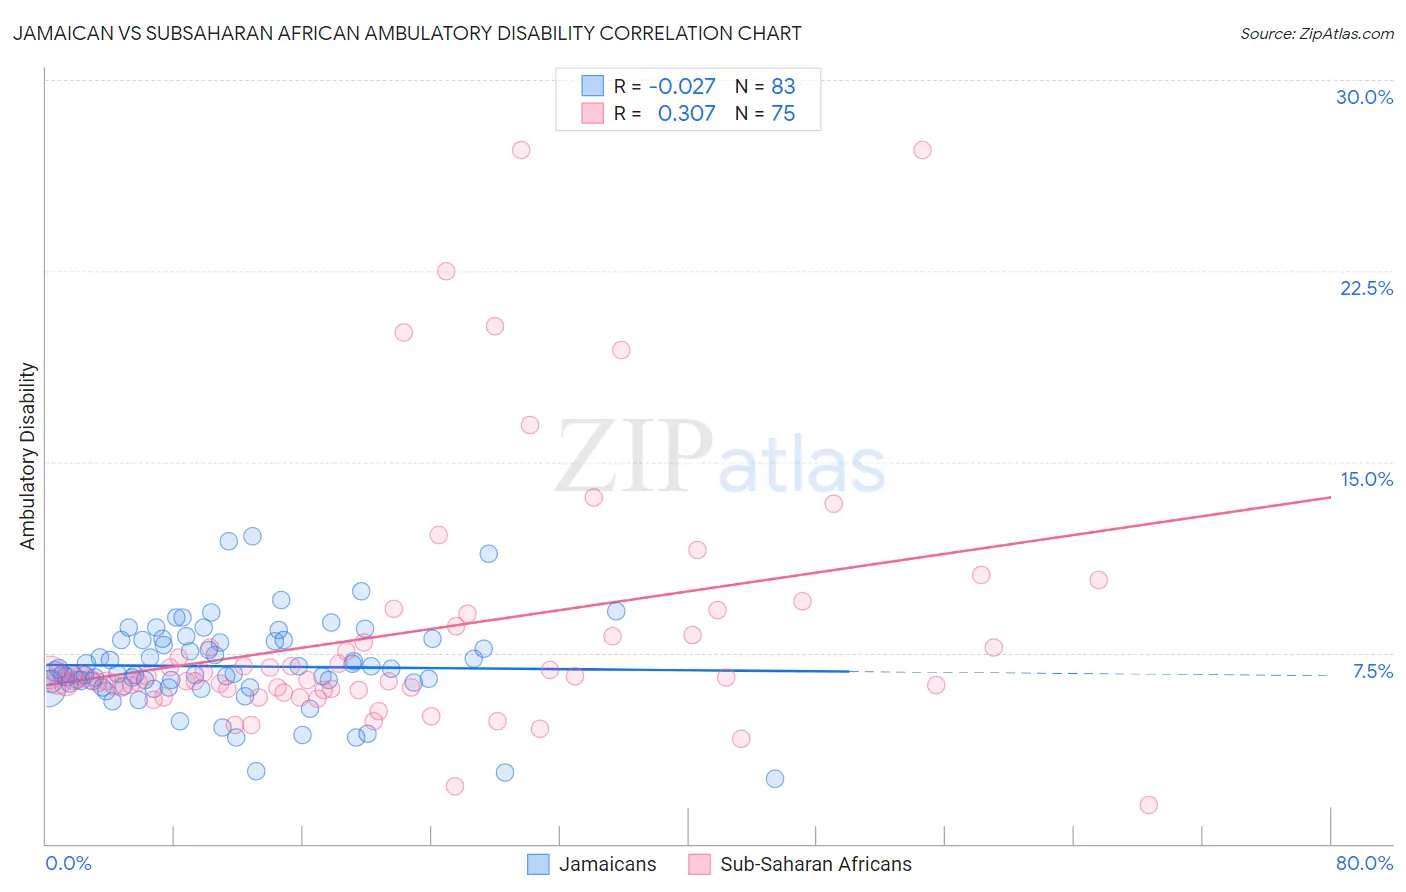
Jamaican vs Subsaharan African Ambulatory Disability Correlation Chart
The statistical analysis conducted on geographies consisting of 367,821,612 people shows no correlation between the proportion of Jamaicans and percentage of population with ambulatory disability in the United States with a correlation coefficient (R) of -0.027 and weighted average of 6.7%. Similarly, the statistical analysis conducted on geographies consisting of 507,846,771 people shows a mild positive correlation between the proportion of Sub-Saharan Africans and percentage of population with ambulatory disability in the United States with a correlation coefficient (R) of 0.307 and weighted average of 6.4%, a difference of 4.6%.
Ambulatory Disability Correlation Summary
| Measurement | Jamaican | Subsaharan African |
| Minimum | 2.5% | 1.5% |
| Maximum | 12.1% | 27.3% |
| Range | 9.5% | 25.7% |
| Mean | 7.0% | 8.3% |
| Median | 6.7% | 6.5% |
| Interquartile 25% (IQ1) | 6.2% | 6.1% |
| Interquartile 75% (IQ3) | 8.0% | 8.2% |
| Interquartile Range (IQR) | 1.8% | 2.1% |
| Standard Deviation (Sample) | 1.7% | 5.0% |
| Standard Deviation (Population) | 1.7% | 4.9% |
Similar Demographics by Ambulatory Disability
Demographics Similar to Jamaicans by Ambulatory Disability
In terms of ambulatory disability, the demographic groups most similar to Jamaicans are Celtic (6.7%, a difference of 0.080%), Immigrants from West Indies (6.7%, a difference of 0.080%), Immigrants from Guyana (6.7%, a difference of 0.11%), Sioux (6.7%, a difference of 0.17%), and Immigrants from Caribbean (6.7%, a difference of 0.39%).
| Demographics | Rating | Rank | Ambulatory Disability |
| Slovaks | 0.1 /100 | #270 | Tragic 6.7% |
| Immigrants | Trinidad and Tobago | 0.1 /100 | #271 | Tragic 6.7% |
| French Canadians | 0.1 /100 | #272 | Tragic 6.7% |
| Whites/Caucasians | 0.1 /100 | #273 | Tragic 6.7% |
| Sioux | 0.1 /100 | #274 | Tragic 6.7% |
| Immigrants | Guyana | 0.1 /100 | #275 | Tragic 6.7% |
| Celtics | 0.1 /100 | #276 | Tragic 6.7% |
| Jamaicans | 0.1 /100 | #277 | Tragic 6.7% |
| Immigrants | West Indies | 0.1 /100 | #278 | Tragic 6.7% |
| Immigrants | Caribbean | 0.0 /100 | #279 | Tragic 6.7% |
| Pennsylvania Germans | 0.0 /100 | #280 | Tragic 6.8% |
| Yaqui | 0.0 /100 | #281 | Tragic 6.8% |
| Barbadians | 0.0 /100 | #282 | Tragic 6.8% |
| Immigrants | Barbados | 0.0 /100 | #283 | Tragic 6.8% |
| Immigrants | Jamaica | 0.0 /100 | #284 | Tragic 6.8% |
Demographics Similar to Sub-Saharan Africans by Ambulatory Disability
In terms of ambulatory disability, the demographic groups most similar to Sub-Saharan Africans are Immigrants from Liberia (6.4%, a difference of 0.030%), Assyrian/Chaldean/Syriac (6.4%, a difference of 0.060%), Hispanic or Latino (6.4%, a difference of 0.060%), Dutch (6.4%, a difference of 0.21%), and Immigrants from Germany (6.4%, a difference of 0.30%).
| Demographics | Rating | Rank | Ambulatory Disability |
| Slavs | 5.1 /100 | #226 | Tragic 6.4% |
| Cubans | 4.0 /100 | #227 | Tragic 6.4% |
| Portuguese | 4.0 /100 | #228 | Tragic 6.4% |
| Czechoslovakians | 3.8 /100 | #229 | Tragic 6.4% |
| Mexicans | 3.5 /100 | #230 | Tragic 6.4% |
| Panamanians | 3.1 /100 | #231 | Tragic 6.4% |
| Assyrians/Chaldeans/Syriacs | 2.4 /100 | #232 | Tragic 6.4% |
| Sub-Saharan Africans | 2.3 /100 | #233 | Tragic 6.4% |
| Immigrants | Liberia | 2.3 /100 | #234 | Tragic 6.4% |
| Hispanics or Latinos | 2.2 /100 | #235 | Tragic 6.4% |
| Dutch | 2.0 /100 | #236 | Tragic 6.4% |
| Immigrants | Germany | 1.8 /100 | #237 | Tragic 6.4% |
| Haitians | 1.8 /100 | #238 | Tragic 6.4% |
| Senegalese | 1.7 /100 | #239 | Tragic 6.4% |
| Immigrants | Senegal | 1.7 /100 | #240 | Tragic 6.4% |